

Answered step by step
Verified Expert Solution
Question
1 Approved Answer
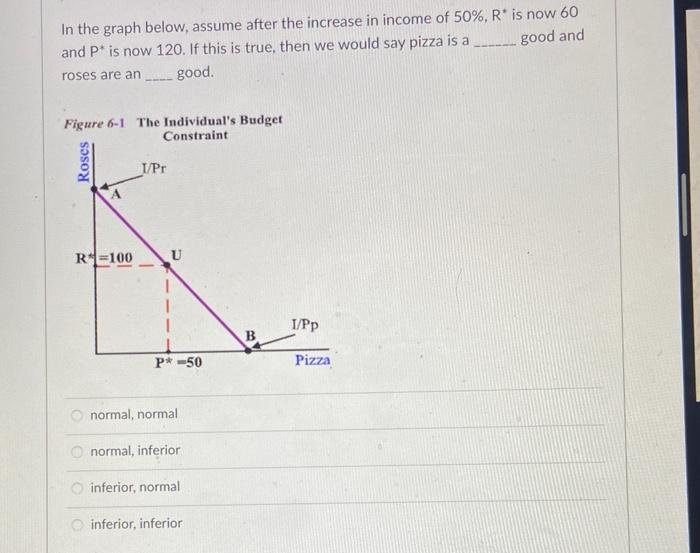
In the graph below, assume after the increase in income of 50%, R* is now 60 and P is now 120. If this is true,
Step by Step Solution
There are 3 Steps involved in it
Step: 1

Get Instant Access to Expert-Tailored Solutions
See step-by-step solutions with expert insights and AI powered tools for academic success
Step: 2

Step: 3
Ace Your Homework with AI
Get the answers you need in no time with our AI-driven, step-by-step assistance
Get Started
Deflation Current And Historical Perspectives
Authors: Richard C. K. Burdekin, Pierre L. Siklos
1st Edition
0521837995,0511227671