Question
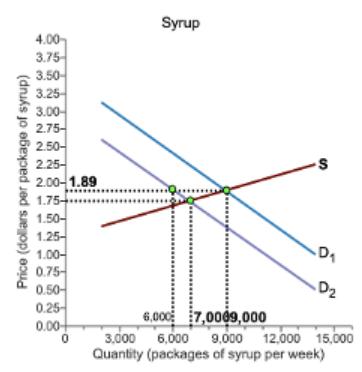
In the graph on the right, the demand for syrup has changed because the price of frozen waffles has risen from $2.50 to $3.50 per
In the graph on the right, the demand for syrup has changed because the price of frozen waffles has risen from $2.50 to $3.50 per package. The cross-price elasticity of demand between frozen waffles and syrup is ____________. Use the midpoint formula and enter your response rounded to two decimal places. Be sure to include the minus sign if necessary.)

Syrup 4.00 3.75- 3.50- 3.25 3.00- 2.75- 2.50- 2.25- 2.00- 1.89 1.75- 1.50- 1.25- 1.00- 0.75- 0.50- 0.25- 0.00- D2 6,000 7,0009,000 3,000 6,000 9,000 12,000 15,000 Quantity (packages of synup per week) Price (dollars per package of syrup)
Step by Step Solution
3.53 Rating (153 Votes )
There are 3 Steps involved in it
Step: 1
ross price elas...
Get Instant Access to Expert-Tailored Solutions
See step-by-step solutions with expert insights and AI powered tools for academic success
Step: 2

Step: 3

Ace Your Homework with AI
Get the answers you need in no time with our AI-driven, step-by-step assistance
Get StartedRecommended Textbook for
Microeconomics
Authors: Austan Goolsbee, Steven Levitt, Chad Syverson
3rd Edition
1319105564, 978-1319105563
Students also viewed these Economics questions
Question
Answered: 1 week ago
Question
Answered: 1 week ago
Question
Answered: 1 week ago
Question
Answered: 1 week ago
Question
Answered: 1 week ago
Question
Answered: 1 week ago
Question
Answered: 1 week ago
Question
Answered: 1 week ago
Question
Answered: 1 week ago
Question
Answered: 1 week ago
Question
Answered: 1 week ago
Question
Answered: 1 week ago
Question
Answered: 1 week ago
Question
Answered: 1 week ago
Question
Answered: 1 week ago
Question
Answered: 1 week ago
Question
Answered: 1 week ago
Question
Answered: 1 week ago
Question
Answered: 1 week ago
Question
Answered: 1 week ago
Question
Answered: 1 week ago
Question
Answered: 1 week ago
Question
Answered: 1 week ago
View Answer in SolutionInn App


