

Question: In the Home Depot, Inc case - The decline in the company's stock price from Jan1985 till Feb1986 made it difficult to rely on equity
In the Home Depot, Inc case - The decline in the company's stock price from Jan1985 till Feb1986 made it difficult to rely on equity financing for growth.What constraints does Home Depot face in its financing policies?
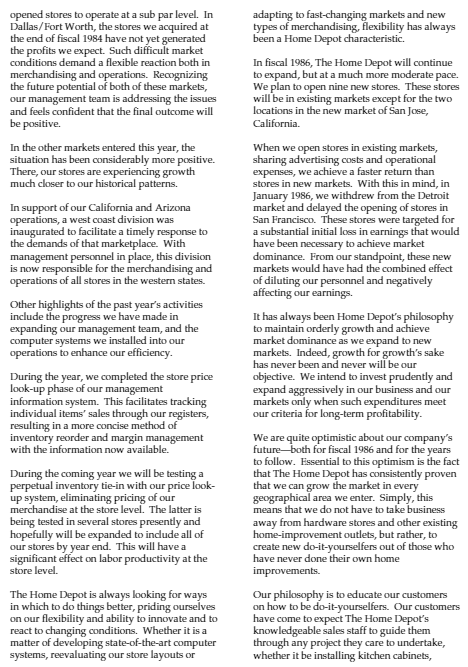
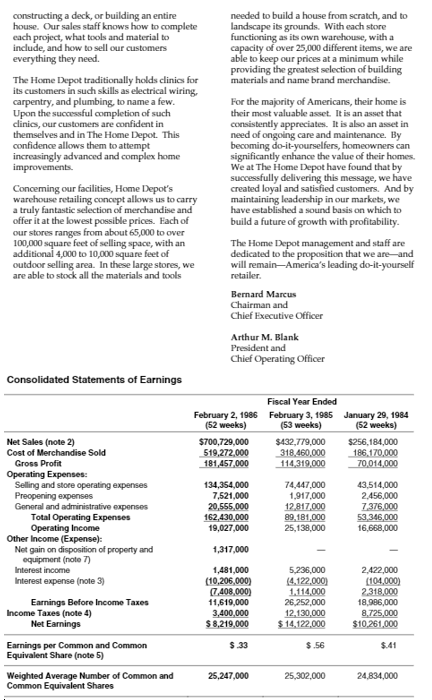
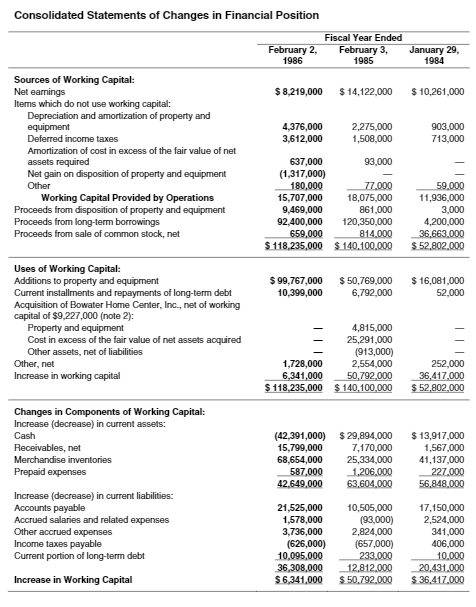
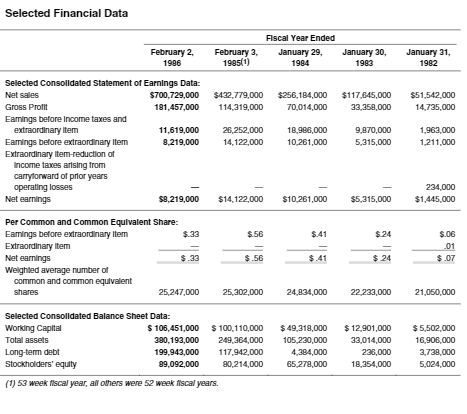
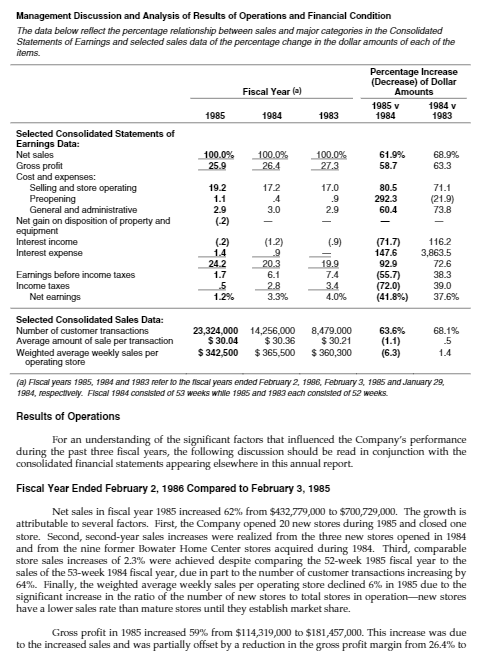
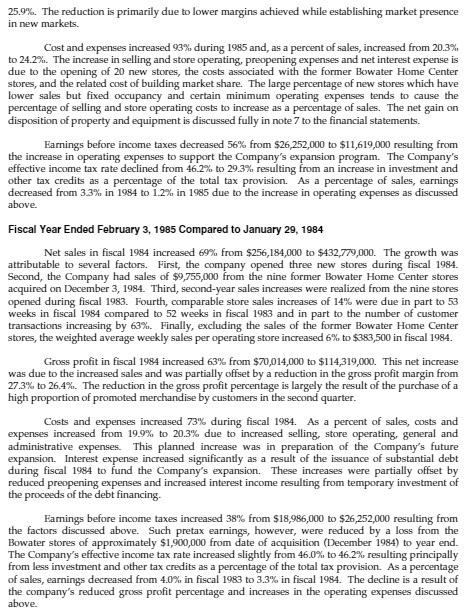
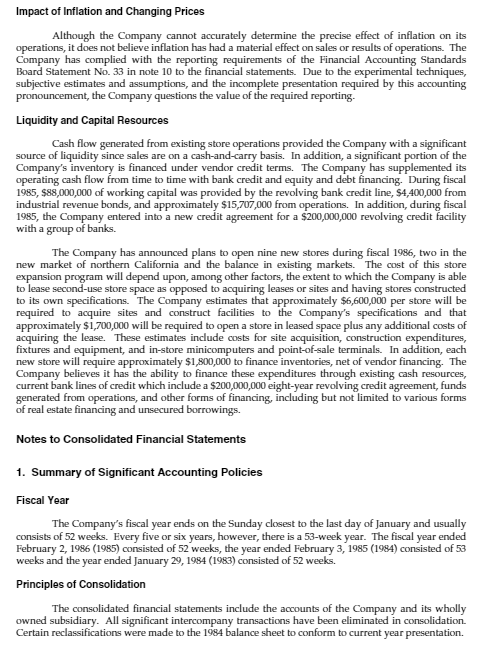
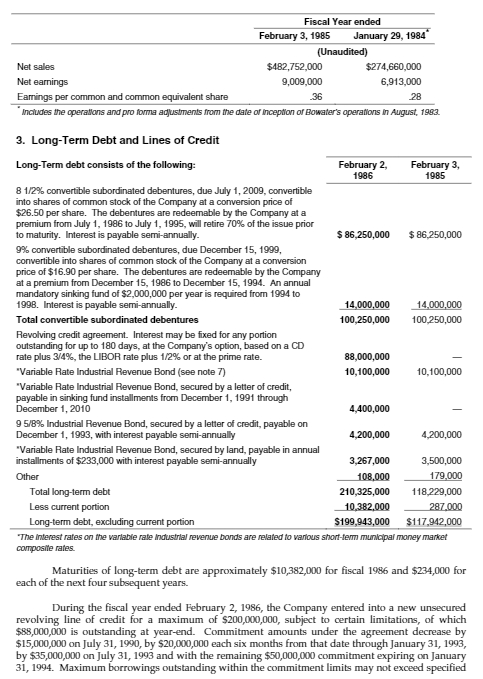
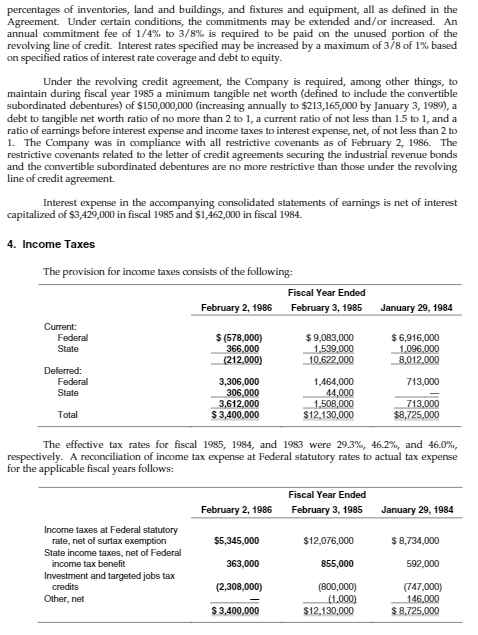
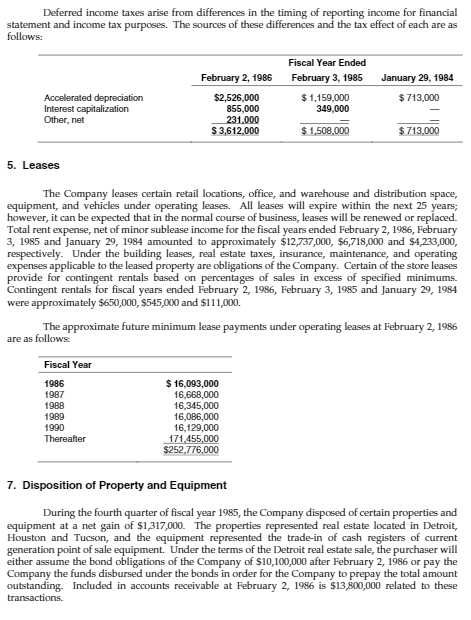
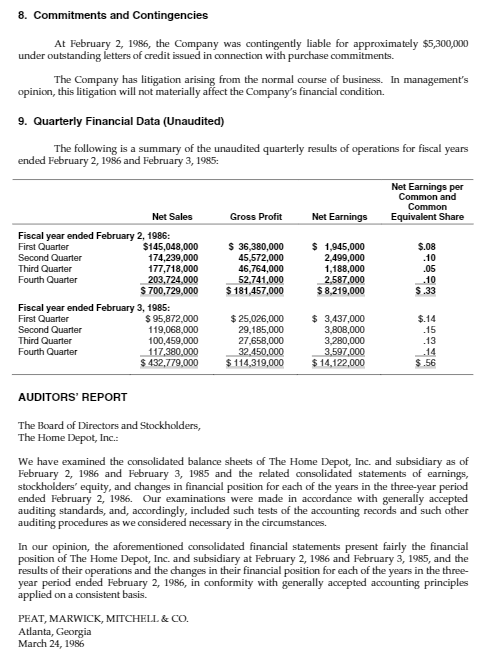
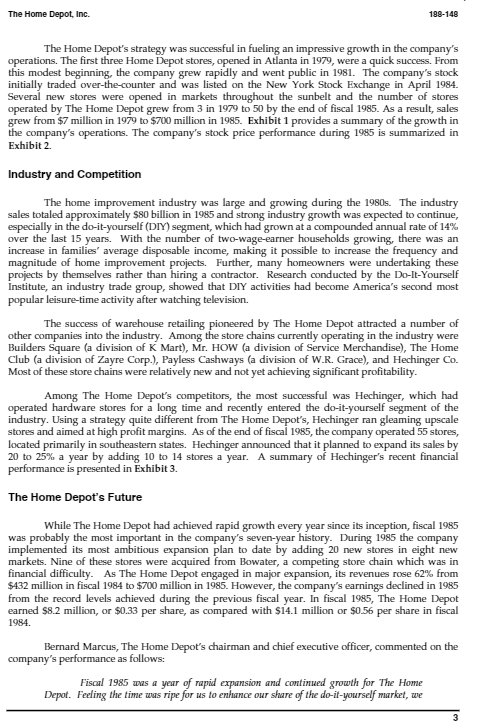
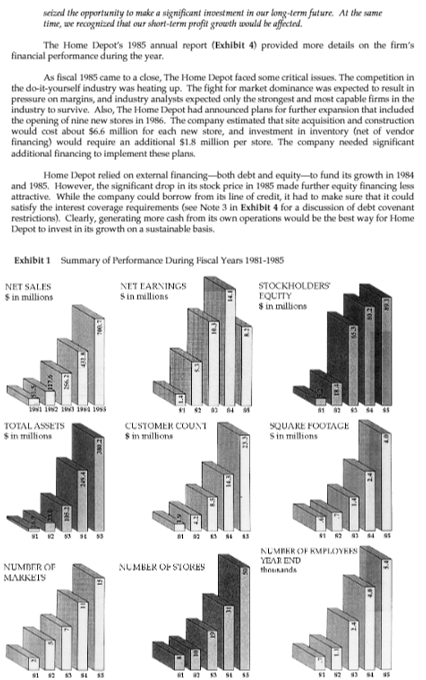
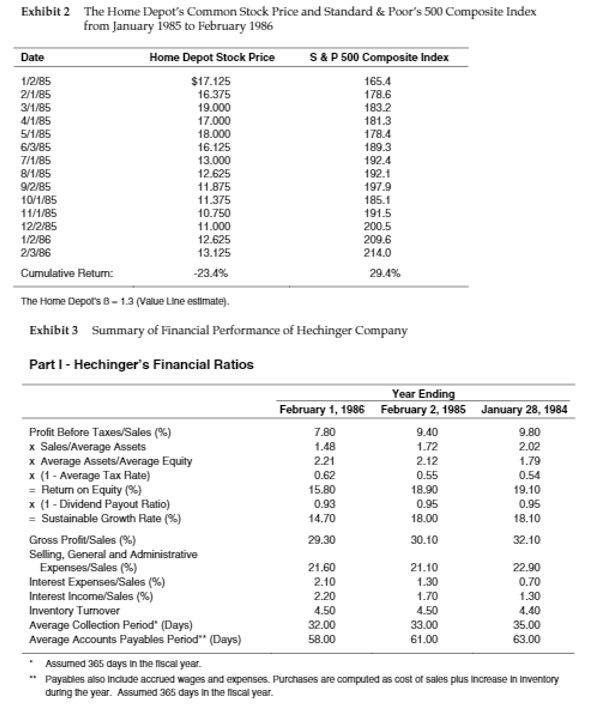
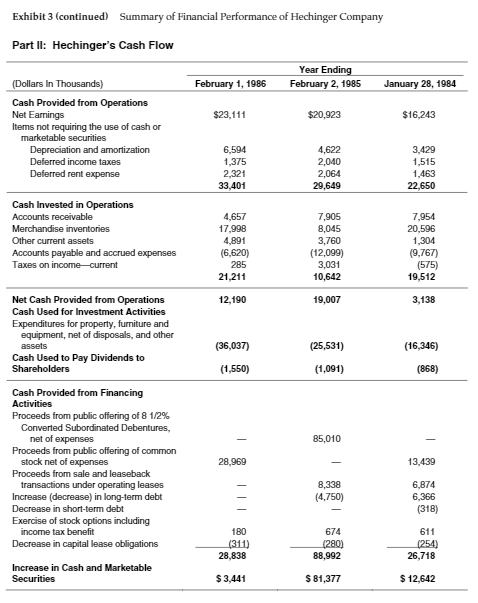
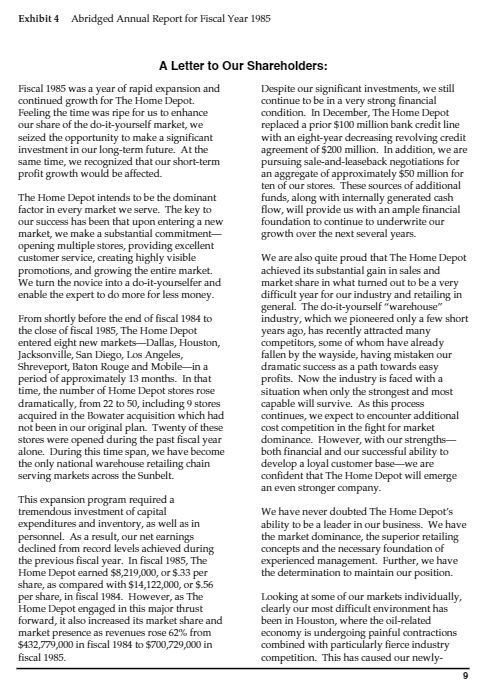
The Home Depot, Inc. The difference between a company with a concept and one without is the difference between a stock that sells for 20 times earnings and one that sells for 10 times earnings. The Home Depot is definitely a concept stock, and it has the multiple to prove it-27-28 times likely earnings in the current fiscal year ending this month. On the face of it, The Home Depot might seem like a tough one for the concept-mongers to work with. It's a chain of hardware stores. But, as we noted in our last visit to the company in the spring of '83, these hardware stores are huge warehouse outlets-60,000 to 80,000 feet in space. You can fit an awful lot of saws in these and still have plenty of room left over to knock together a very decent concept. And in truth, the warehouse notion is the hottest thing in retailing these days. The Home Depot buys in quantum quantities, which means that its suppliers are eager to keep within its good graces and hence provide it with a lot of extra service. The company, as it happens, is masterful in promotion and pricing. The last time we counted, it had 22 stores, all of them located where the sun shines all the time. Growth has been sizzling. Revenues, a mere $22 million in fiscal '80, shot past the quarter billion mark three years later. As to earnings, they have climbed from two cents in fiscal '80 to an estimated 60 cents in the fiscal year coming to an end [in January 1985]. Its many boosters in the Street, moreover, anticipate more of the same as far as the bullish eye can see. They're confidently estimating 30% growth in the new fiscal year as well. Could be. But while we share their esteem for the company's merchandising skills and imagination, we're as bemused now as we were the first time we looked at The Home Depot by its rich multiple. Maybe a little more now than then.! The above report appeared on January 21, 1985, in "Up & Down Wall Street," a regular column in Barron's financial weekly. Company Background Bernard Marcus and Arthur Blank founded The Home Depot in 1978 to bring the warehouse retailing concept to the home center industry. The company operated retail "do-it-yourself" (DIY) warehouse stores which sold a wide assortment of building materials and home improvement 1 Reprinted with permission from Barron's, January 21, 1985. This case was prepared by Professor Krishna Palepu as the basis for class discussion rather than to illustrate either effective or ineffective handling of an administrative situation.opened stores to operate at a sub par level. In adapting to fast-changing markets and new Dallas/Fort Worth, the stores we acquired at types of merchandising, flexibility has always the end of fiscal 1984 have not yet generated been a Home Depot characteristic. the profits we expect. Such difficult market conditions demand a flexible reaction both in In fiscal 1986, The Home Depot will continue merchandising and operations. Recognizing to expand, but at a much more moderate pace. the future potential of both of these markets, We plan to open nine new stores. These stores our management team is addressing the issues will be in existing markets except for the two and feels confident that the final outcome will locations in the new market of San Jose, be positive. California. In the other markets entered this year, the When we open stores in existing markets, situation has been considerably more positive. sharing advertising costs and operational There, our stores are experiencing growth expenses, we achieve a faster return than much closer to our historical patterns. stores in new markets. With this in mind, in January 1986, we withdrew from the Detroit In support of our California and Arizona market and delayed the opening of stores in operations, a west coast division was San Francisco. These stores were targeted for inaugurated to facilitate a timely response to a substantial initial loss in earnings that would the demands of that marketplace. With have been necessary to achieve market management personnel in place, this division dominance. From our standpoint, these new is now responsible for the merchandising and markets would have had the combined effect operations of all stores in the western states. of diluting our personnel and negatively affecting our earnings. Other highlights of the past year's activities include the progress we have made in It has always been Home Depot's philosophy expanding our management team, and the to maintain orderly growth and achieve computer systems we installed into our market dominance as we expand to new operations to enhance our efficiency. markets. Indeed, growth for growth's sake has never been and never will be our During the year, we completed the store price objective. We intend to invest prudently and look-up phase of our management expand aggressively in our business and our information system. This facilitates tracking markets only when such expenditures meet individual items' sales through our registers, our criteria for long-term profitability. resulting in a more concise method of inventory reorder and margin management We are quite optimistic about our company's with the information now available. future-both for fiscal 1986 and for the years to follow. Essential to this optimism is the fact During the coming year we will be testing a that The Home Depot has consistently proven perpetual inventory tie-in with our price look- that we can grow the market in every up system, eliminating pricing of our geographical area we enter. Simply, this merchandise at the store level. The latter is means that we do not have to take business being tested in several stores presently and away from hardware stores and other existing hopefully will be expanded to indude all of home-improvement outlets, but rather, to our stores by year end. This will have a create new do-it-yourselfers out of those who significant effect on labor productivity at the have never done their own home store level. improvements. The Home Depot is always looking for ways Our philosophy is to educate our customers in which to do things better, priding ourselves on how to be do-it-yourselfers. Our customers on our flexibility and ability to innovate and to have come to expect The Home Depot's react to changing conditions. Whether it is a knowledgeable sales staff to guide them matter of developing state-of-the-art computer through any project they care to undertake, systems, reevaluating our store layouts or whether it be installing kitchen cabinets,\f\fConsolidated Statements of Changes in Financial Position Fiscal Year Ended February 2, February 3, January 29, 1986 1985 1984 Sources of Working Capital: Net earnings $ 8.219,000 $ 14,122,000 $ 10,261,000 Items which do not use working capital: Depreciation and amortization of property and equipment 4,376,000 2,275,000 903,000 Deferred income taxes 3,612,000 1,508,000 713,000 Amortization of cost in excess of the fair value of net assets required 637,000 93.000 Net gain on disposition of property and equipment (1,317,000) Other 180,000 77.000 59.000 Working Capital Provided by Operations 15,707,000 18,075,000 11,936,000 Proceeds from disposition of property and equipment 9.469,000 861,000 3,000 Proceeds from long-term borrowings 92,400,000 120,350,000 4,200,000 Proceeds from sale of common stock, net 659,000 814.000 36,663,000 $ 118,235,000 $ 140,100.000 $ 52,802.000 Uses of Working Capital: Additions to property and equipment $ 99,767,000 $ 50,769,000 $ 16,081,000 Current installments and repayments of long-term debt 10,399,000 6,792,000 52,000 Acquisition of Bowater Home Center, Inc., net of working capital of $9,227,000 (note 2): Property and equipment 4,815,000 Cost in excess of the fair value of net assets acquired 25,291,000 Other assets, net of liabilities (913,000) Other, net 1,728,000 2,554,000 252,000 Increase in working capital 6,341,000 50,792,000 36,417,000 $ 118 235,000 $ 140,100,000 $ 52,802,000 Changes in Components of Working Capital: Increase (decrease) in current assets: Cash (42,391,000) $ 20,894,000 $ 13,917,000 Receivables, net 15,799,000 7,170,000 1,567,000 Merchandise inventories 68.654,000 25,334,000 41,137,000 Prepaid expenses 587,000 1,206,000 227.000 42.649,000 63,604.000 56,848.000 Increase (decrease) in current liabilities: Accounts payable 21,525,000 10,505,000 17,150,000 Accrued salaries and related expenses 1,578,000 (93,000) 2,524,000 Other accrued expenses 3.736,000 2,824,000 341,000 Income taxes payable (626,000) (657,000) 406,000 Current portion of long-term debt 10 095,000 233.000 10.000 36,308,000 12,812.000 20,431.000 Increase in Working Capital $ 6,341,000 $ 50,792.000 $ 36,417,000Selected Financial Data Flacal Year Ended February 2, February 3, January 29, January 30, January 31, 1986 1925(1) 1984 1982 Selected Consolidated Statement of Earnings Data: Net sales $700,729,000 $432,779,000 $256,184,000 $117 845,000 $51,542,000 Gross Profit 181,457,000 114,319,000 70.014,000 33,358,000 14.735,000 Eamings before Income taxes and extraordinary item 11,619,000 26,252,000 18.986,000 9.870,000 1,963,000 Eamings before extraordinary Item 8.219,000 14,122,000 10 261,000 5,315,000 1,21 1,000 Extraordinary Item-reduction of Income taxes arising from carryforward of prior years operating losses 234,000 Net earnings $8,219,000 $14,122,000 $10.261,000 $5,315,000 $1,445,000 Per Common and Common Equivalent Share: Eamings before extraordinary Item $.33 $.56 $.41 $.24 $.06 Extraordinary Item 101 Net earnings $.33 $.56 $.41 $ .24 $ .07 Welghted average number of common and common equivalent shares 25,247,000 25,302,000 24,834,000 22.233,000 21.060,000 Selected Consolidated Balance Sheet Data: Working Capital $ 106,451,000 $ 100,110,000 $ 49.318,000 $ 12.901,000 $ 6 502,000 Total assets 390,193,000 249,364,000 105 230,000 33,014,000 16,908,000 Long-term debt 199.943,000 117,942,000 4,384,000 236,000 3,738,000 Stockholders' equity 89,092,000 80,214,000 65,278,000 18,354,000 5,024,000 (1) 53 week fiscal year, all others were 52 week fiscal years.Management Discussion and Analysis of Results of Operations and Financial Condition The data below reflect the percentage relationship between sales and major categories in the Consolidated Statements of Earnings and selected sales data of the percentage change in the dollar amounts of each of the items. Percentage Increase (Decrease) of Dollar Fiscal Year () Amounts 1985 v 1984 v 1985 1984 1983 1984 1983 Selected Consolidated Statements of Earnings Data: Net sales 100.0% 100 0% 100.0% 61.9% 68.9% Gross profit 25.9 26.4 27.3 58.7 63.3 Cost and expenses: Selling and store operating 19 2 172 17.0 80.5 71.1 Preopening 1.1 -4 .9 292.3 (21.9) General and administrative 20 3.0 2.9 60.4 73.B Net gain on disposition of property and (2) equipment Interest income (2) (1.2) (.9) (71.7) 116.2 Interest expense 1.4 147.6 3,863.5 24.2 20.3 19.9 92.9 72.6 Earnings before income taxes 1.7 6.1 7.4 (55.7) 38.3 Income taxes 5 2.B 3.4 (72.0) 39.0 Net earnings 1.2% 3.3% 4.0% (41.8%%) 37.6% Selected Consolidated Sales Data: Number of customer transactions 23,324,000 14,256.000 8,479.000 63.6% 68.1% Average amount of sale per transaction $ 30.04 $ 30.36 $ 30.21 (1.1) Weighted average weekly sales per $ 342,500 $ 365,500 $ 360,300 (6.3) 1.4 operating store (a) Fiscal years 1985, 1984 and 1983 refer to the fiscal years ended February 2, 1896, February 3, 1985 and January 29, 1984, respectively. Fiscal 1994 consisted of 53 weeks while 1985 and 1983 each consisted of 52 weeks. Results of Operations For an understanding of the significant factors that influenced the Company's performance during the past three fiscal years, the following discussion should be read in conjunction with the consolidated financial statements appearing elsewhere in this annual report. Fiscal Year Ended February 2, 1986 Compared to February 3, 1985 Net sales in fiscal year 1985 increased 62% from $432,779,000 to $700,729,000. The growth is attributable to several factors. First, the Company opened 20 new stores during 1985 and closed one store. Second, second-year sales increases were realized from the three new stores opened in 1984 and from the nine former Bowater Home Center stores acquired during 1984. Third, comparable store sales increases of 2.3% were achieved despite comparing the 52-week 1985 fiscal year to the sales of the 53-week 1984 fiscal year, due in part to the number of customer transactions increasing by 64%. Finally, the weighted average weekly sales per operating store declined 6% in 1985 due to the significant increase in the ratio of the number of new stores to total stores in operation-new stores have a lower sales rate than mature stores until they establish market share. Gross profit in 1985 increased 59% from $114,319,000 to $181,457,000. This increase was due to the increased sales and was partially offset by a reduction in the gross profit margin from 26.4% to25.9%. The reduction is primarily due to lower margins achieved while establishing market presence in new markets. Cost and expenses increased 93%% during 1985 and, as a percent of sales, increased from 20.3% to 24.2%. The increase in selling and store operating, preopening expenses and net interest expense is due to the opening of 20 new stores, the costs associated with the former Bowater Home Center stores, and the related cost of building market share. The large percentage of new stores which have lower sales but fixed occupancy and certain minimum operating expenses tends to cause the percentage of selling and store operating costs to increase as a percentage of sales. The net gain on disposition of property and equipment is discussed fully in note 7 to the financial statements. Earnings before income taxes decreased 56% from $26,252,000 to $11,619,000 resulting from the increase in operating expenses to support the Company's expansion program. The Company's effective income tax rate declined from 46.2% to 293% resulting from an increase in investment and other tax credits as a percentage of the total tax provision. As a percentage of sales, earnings decreased from 3.3% in 1984 to 1.2% in 1985 due to the increase in operating expenses as discussed above. Fiscal Year Ended February 3, 1985 Compared to January 29, 1984 Net sales in fiscal 1984 increased 69%% from $256,184,000 to $432,779,000. The growth was attributable to several factors. First, the company opened three new stores during fiscal 1984. Second, the Company had sales of $9,755,000 from the nine former Bowater Home Center stores acquired on December 3, 1984. Third, second-year sales increases were realized from the nine stores opened during fiscal 1983. Fourth, comparable store sales increases of 14% were due in part to 53 weeks in fiscal 1984 compared to 52 weeks in fiscal 1983 and in part to the number of customer transactions increasing by 63%%. Finally, excluding the sales of the former Bowater Home Center stores, the weighted average weekly sales per operating store increased 6% to $383,500 in fiscal 1984. Gross profit in fiscal 1984 increased 63% from $70,014,000 to $114,319,000. This net increase was due to the increased sales and was partially offset by a reduction in the gross profit margin from 27.3% to 26.4%. The reduction in the gross profit percentage is largely the result of the purchase of a high proportion of promoted merchandise by customers in the second quarter. Costs and expenses increased 73% during fiscal 1984. As a percent of sales, costs and expenses increased from 19.9% to 20.3% due to increased selling, store operating, general and administrative expenses. This planned increase was in preparation of the Company's future expansion. Interest expense increased significantly as a result of the issuance of substantial debt during fiscal 1984 to fund the Company's expansion. These increases were partially offset by reduced preopening expenses and increased interest income resulting from temporary investment of the proceeds of the debt financing. Earnings before income taxes increased 38% from $18,986,000 to $26,252,000 resulting from the factors discussed above. Such pretax earnings, however, were reduced by a loss from the Bowater stores of approximately $1,900,000 from date of acquisition (December 1984) to year end. The Company's effective income tax rate increased slightly from 46.0% to 46.2% resulting principally from less investment and other tax credits as a percentage of the total tax provision. As a percentage of sales, earnings decreased from 4.0% in fiscal 1983 to 3.3% in fiscal 1984. The decline is a result of the company's reduced gross profit percentage and increases in the operating expenses discussed above.Impact of Inflation and Changing Prices Although the Company cannot accurately determine the precise effect of inflation on its operations, it does not believe inflation has had a material effect on sales or results of operations. The Company has complied with the reporting requirements of the Financial Accounting Standards Board Statement No. 33 in note 10 to the financial statements. Due to the experimental techniques, subjective estimates and assumptions, and the incomplete presentation required by this accounting pronouncement, the Company questions the value of the required reporting. Liquidity and Capital Resources Cash flow generated from existing store operations provided the Company with a significant source of liquidity since sales are on a cash-and-carry basis. In addition, a significant portion of the Company's inventory is financed under vendor credit terms. The Company has supplemented its operating cash flow from time to time with bank credit and equity and debt financing. During fiscal 1985, $88,000,000 of working capital was provided by the revolving bank credit line, $4,400,000 from industrial revenue bonds, and approximately $15,707,000 from operations. In addition, during fiscal 1985, the Company entered into a new credit agreement for a $200,000,000 revolving credit facility with a group of banks. The Company has announced plans to open nine new stores during fiscal 1986, two in the new market of northern California and the balance in existing markets. The cost of this store expansion program will depend upon, among other factors, the extent to which the Company is able to lease second-use store space as opposed to acquiring leases or sites and having stores constructed to its own specifications. The Company estimates that approximately $6,600,000 per store will be required to acquire sites and construct facilities to the Company's specifications and that approximately $1,700,000 will be required to open a store in leased space plus any additional costs of acquiring the lease. These estimates include costs for site acquisition, construction expenditures, fixtures and equipment, and in-store minicomputers and point-of-sale terminals. In addition, each new store will require approximately $1,800,000 to finance inventories, net of vendor financing. The Company believes it has the ability to finance these expenditures through existing cash resources, current bank lines of credit which include a $200,000,000 eight-year revolving credit agreement, funds generated from operations, and other forms of financing, including but not limited to various forms of real estate financing and unsecured borrowings. Notes to Consolidated Financial Statements 1. Summary of Significant Accounting Policies Fiscal Year The Company's fiscal year ends on the Sunday closest to the last day of January and usually consists of 52 weeks. Every five or six years, however, there is a 53-week year. The fiscal year ended February 2, 1986 (1985) consisted of 52 weeks, the year ended February 3, 1985 (1984) consisted of 53 weeks and the year ended January 29, 1984 (1983) consisted of 52 weeks. Principles of Consolidation The consolidated financial statements include the accounts of the Company and its wholly owned subsidiary. All significant intercompany transactions have been eliminated in consolidation. Certain reclassifications were made to the 1984 balance sheet to conform to current year presentation.products. Sales, which were on a cash-and-carry basis, were concentrated in the home remodeling market. The company targeted as its customers individual homeowners and small contractors. The Home Depot's strategy had several important elements. The company offered low and competitive prices, a feature central to the warehouse retailing concept. The Home Depot's stores, usually in suburbs, were also the warehouses, with inventory stacked over merchandise displayed on industrial racks. The warehouse format of the stores kept the overhead low and allowed the company to pass the savings to customers. Costs were further reduced by emphasizing higher volume and lower margins with a high inventory turnover. While offering low prices, The Home Depot was careful not to sacrifice the depth of merchandise and the quality of products offered for sale. To ensure that the right products were stocked at all times, each Home Depot store carried approximately $4,500,000 of inventory, at retail, consisting of approximately 25,000 separate stock- keeping units. All these items were kept on the sales floor of the store, thus increasing convenience to the customer and minimizing out-of-stock occurrences. The company also assured its customers that the products sold by it were of the best quality. The Home Depot offered nationally advertised brands as well as lesser known brands carefully chosen by the company's merchandise managers. Every product sold by The Home Depot was guaranteed by either the manufacturer or by the company itself. The Home Depot complemented the above merchandising strategy with excellent sales assistance. Since the great majority of the company's customers were individual homeowners with no prior experience in their home improvement projects, The Home Depot considered its employees' technical knowledge and service orientation to be very important to its marketing success. The company pursued a number of policies to address this need. Approximately 90% of the company's employees were on a full-time basis. To attract and retain a strong sales force, the company maintained salary and wage levels above those of its competitors. All the floor sales personnel attended special training sessions to gain thorough knowledge of the company's home improvement products and their basic applications. This training enabled them to answer shoppers' questions and help customers in choosing equipment and material appropriate for their projects. Often, the expert advice the sales personnel provided created a bond that resulted in continuous contact with the customer throughout the duration of the customer's project. Finally, to attract customers, The Home Depot pursued an aggressive advertising program utilizing newspapers, television, radio, and direct mail catalogues. The company's advertising stressed promotional pricing, the broad assortment and depth of its merchandise, and the assistance provided by its sales personnel. The company also sponsored in-store demonstrations of do-it- yourself techniques and product uses. To increase customers' shopping convenience, The Home Depot's stores were open seven days a week, including weekday evenings. Fortune magazine commented on The Home Depot's strategy as follows: Warehouse stores typically offer shoppers deep discounts with minimal service and back-to- basics ambiance. The Home Depot's outlets have all the charm of a freight yard and predictably low prices. But they also offer unusually helpful customer service. Although warehouse retailing looks simple, it is not: As discounting cuts into gross profit margins, the merchant must carefully control buying, merchandising, and inventory costs. Throwing in service, which is expensive and hard to systematize, makes the job even tougher. In the do-it- yourself (DIY) segment of the industry-which includes old-style hardware stores, building supply warehouses, and the everything-under-one-roof home centers-The Home Depot is the only company that has successfully brought off the union of low prices and high service.?Merchandise Inventories Inventories are stated at the lower of cost (first-in, first-out) or market, as determined by the retail inventory method. Depreciation and Amortization The Company's buildings, furniture, fixtures, and equipment are depreciated using the straight-line method over the estimated useful lives of the assets. Improvements to leased premises are amortized on the straight-line method over the life of the lease or the useful life of the improvement, whichever is shorter. Investment Tax Credit Investment tax credits are recorded as a reduction of Federal income taxes in the year the credits are realized. Store Preopening Costs Non-capital expenditures associated with opening new stores are charged to expense as incurred. Earnings Per Common and Common Equivalent Share Earnings per common and common equivalent share are based on the weighted average number of shares and equivalents outstanding. Common equivalent shares used in the calculation of earnings per share represent shares granted under the Company's employee stock option plan and employee stock purchase plan. Shares issuable upon conversion of the $ 1/2% convertible subordinated debentures are also common stock equivalents. Shares issuable upon conversion of the 9% convertible subordinated debentures would only be included in the computation of fully diluted earnings per share. However, neither shares issuable upon conversion of the 8 1/2% nor the 9% convertible debentures were dilutive in any year presented, and thus neither were considered in the earnings per share computations. 2. Acquisition On December 3, 1984 the Company acquired the outstanding capital stock of Bowater Home Center, Inc. (Bowater) for approximately $38,420,000 including costs incurred in connection with the acquisition. Bowater operated nine retail home center stores primarily in the Dallas, Texas metropolitan area. The acquisition was accounted for by the purchase method and, accordingly, results of operations have been included with those of the Company from the date of acquisition. Cost in excess of the fair value of net assets acquired amounted to approximately $25,291,000, which is being amortized over forty years from date of acquisition using the straight-line method. The following table summarizes, on a pro forma, unaudited basis, the estimated combined results of operations of the Company and Bowater for the years ended February 3, 1985 and January 29, 1984, as though the acquisition were made at the beginning of fiscal year 1983. This pro forma information does not purport to be indicative of the results of operations which would have actually been obtained if the acquisition had been effective on the dates indicated.Fiscal Year ended February 3, 1985 January 29, 1984 (Unaudited) Net sales $482,752,000 $274,660,000 Net earnings 9,009,000 6,913,000 Earnings per common and common equivalent share -36 Includes the operations and pro forma adjustments from the date of inception of Bowater's operations in August, 1983. 3. Long-Term Debt and Lines of Credit Long-Term debt consists of the following: February 2, February 3, 1986 1985 B 1/2% convertible subordinated debentures, due July 1, 2009, convertible into shares of common stock of the Company at a conversion price of $26.50 per share. The debentures are redeemable by the Company at a premium from July 1, 1986 to July 1, 1995, will retire 70% of the issue prior to maturity. Interest is payable semi-annually. $ 86,250,000 $ 86.250,000 9% convertible subordinated debentures, due December 15, 1999, convertible into shares of common stock of the Company at a conversion price of $16.90 per share. The debentures are redeemable by the Company at a premium from December 15, 1986 to December 15, 1994. An annual mandatory sinking fund of $2,000,000 per year is required from 1994 to 1908. Interest is payable semi-annually. 14,000,000 14,000,000 Total convertible subordinated debentures 100 250,000 100 250,000 Revolving credit agreement. Interest may be fixed for any portion outstanding for up to 180 days, at the Company's option, based on a CD rate plus 3/4%, the LIBOR rate plus 1/2% or at the prime rate. 88,000,000 "Variable Rate Industrial Revenue Bond (see note 7) 10,100,000 10,100,000 "Variable Rate Industrial Revenue Bond, secured by a letter of credit, payable in sinking fund installments from December 1, 1991 through December 1, 2010 4,400,000 9 5/8% Industrial Revenue Bond, secured by a letter of credit, payable on December 1, 1993, with interest payable semi-annually 4,200,000 4.200,000 "Variable Rate Industrial Revenue Bond, secured by land, payable in annual installments of $233,000 with interest payable semi-annually 3,267,000 3,500,000 Other 108,000 179.000 Total long-term debt 210,325,000 118,229,000 Less current portion 10.382,000 287.000 Long-term debt, excluding current portion $199,943,000 $117,942,000 "The interest rates on the variable rate Industrial revenue bonds are related to various short-term municipal money market composite rates. Maturities of long-term debt are approximately $10,382,000 for fiscal 1986 and $234,000 for each of the next four subsequent years. During the fiscal year ended February 2, 1986, the Company entered into a new unsecured revolving line of credit for a maximum of $200,000,000, subject to certain limitations, of which $88,000,000 is outstanding at year-end. Commitment amounts under the agreement decrease by $15,000,000 on July 31, 1990, by $20,000,000 each six months from that date through January 31, 1993, by $35,000,000 on July 31, 1993 and with the remaining $50,000,000 commitment expiring on January 31, 1994. Maximum borrowings outstanding within the commitment limits may not exceed specifiedpercentages of inventories, land and buildings, and fixtures and equipment, all as defined in the Agreement. Under certain conditions, the commitments may be extended and/or increased. An annual commitment fee of 1/4%% to 3/8% is required to be paid on the unused portion of the revolving line of credit. Interest rates specified may be increased by a maximum of 3/8 of 1% based on specified ratios of interest rate coverage and debt to equity. Under the revolving credit agreement, the Company is required, among other things, to maintain during fiscal year 1985 a minimum tangible net worth (defined to include the convertible subordinated debentures) of $150,000,000 (increasing annually to $213,165,000 by January 3, 1989), a debt to tangible net worth ratio of no more than 2 to 1, a current ratio of not less than 1.5 to 1, and a ratio of earnings before interest expense and income taxes to interest expense, net, of not less than 2 to 1. The Company was in compliance with all restrictive covenants as of February 2, 1986. The restrictive covenants related to the letter of credit agreements securing the industrial revenue bonds and the convertible subordinated debentures are no more restrictive than those under the revolving line of credit agreement. Interest expense in the accompanying consolidated statements of earnings is net of interest capitalized of $3,429,000 in fiscal 1985 and $1,462,000 in fiscal 1984. 4. Income Taxes The provision for income taxes consists of the following: Fiscal Year Ended February 2, 1986 February 3, 1985 January 29, 1984 Current: Federal $ (578,000) $ 9,083,000 $ 6,916,000 State 366,000 1.539,000 1,096.000 (212,000) 10.622,000 8.012.000 Deferred: Federal 3,306,000 1,464,000 713,000 State 306,000 44,000 3,612,000 1,508,000 713.000 Total $ 3,400,000 $12.130,000 $8,725,000 The effective tax rates for fiscal 1985, 1984, and 1983 were 29.3%, 46.2%, and 46.0%%, respectively. A reconciliation of income tax expense at Federal statutory rates to actual tax expense for the applicable fiscal years follows: Fiscal Year Ended February 2, 1986 February 3, 1985 January 29, 1984 Income taxes at Federal statutory rate, net of surtax exemption $5,345,000 $12,076,000 $ 8,734,000 State income taxes, net of Federal income tax benefit 363,000 855,000 592,000 Investment and targeted jobs tax credits (2,308,000) (BDD,000) (747,000) Other, net (1,000) 146.000 $ 3,400,000 $12.130,000 $ 8,725,000Deferred income taxes arise from differences in the timing of reporting income for financial statement and income tax purposes. The sources of these differences and the tax effect of each are as follows: Fiscal Year Ended February 2, 1986 February 3, 1985 January 29, 1984 Accelerated depreciation $2,526,000 $ 1,159,000 $ 713,000 Interest capitalization 855,000 349,000 Other, net 231,000 $ 3,612,000 $ 1,508,000 $ 713,000 5. Leases The Company leases certain retail locations, office, and warehouse and distribution space, equipment, and vehicles under operating leases. All leases will expire within the next 25 years; however, it can be expected that in the normal course of business, leases will be renewed or replaced. Total rent expense, net of minor sublease income for the fiscal years ended February 2, 1986, February 3, 1985 and January 29, 1984 amounted to approximately $12,737,000, $6,718,000 and $4,233,000, respectively. Under the building leases, real estate taxes, insurance, maintenance, and operating expenses applicable to the leased property are obligations of the Company. Certain of the store leases provide for contingent rentals based on percentages of sales in excess of specified minimums. Contingent rentals for fiscal years ended February 2, 1986, February 3, 1985 and January 29, 1984 were approximately $650,000, $545,000 and $11 1,000. The approximate future minimum lease payments under operating leases at February 2, 1986 are as follows: Fiscal Year 1986 $ 16,093,000 1987 16.668,000 198B 16,345,000 1989 16,086,000 1990 16,129,000 Thereafter 171.455,000 $252,776,000 7. Disposition of Property and Equipment During the fourth quarter of fiscal year 1985, the Company disposed of certain properties and equipment at a net gain of $1,317,000. The properties represented real estate located in Detroit, Houston and Tucson, and the equipment represented the trade-in of cash registers of current generation point of sale equipment. Under the terms of the Detroit real estate sale, the purchaser will either assume the bond obligations of the Company of $10,100,000 after February 2, 1986 or pay the Company the funds disbursed under the bonds in order for the Company to prepay the total amount outstanding. Included in accounts receivable at February 2, 1986 is $13,800,000 related to these transactions.8. Commitments and Contingencies At February 2, 1986, the Company was contingently liable for approximately $5,300,000 under outstanding letters of credit issued in connection with purchase commitments. The Company has litigation arising from the normal course of business. In management's opinion, this litigation will not materially affect the Company's financial condition. 9. Quarterly Financial Data (Unaudited) The following is a summary of the unaudited quarterly results of operations for fiscal years ended February 2, 1986 and February 3, 1985: Net Earnings per Common and Common Net Sales Gross Profit Net Earnings Equivalent Share Fiscal year ended February 2, 1986: First Quarter $145,048,000 $ 36,380,000 $ 1,945,000 $.08 Second Quarter 174,239,000 45,572,000 2.499,000 .10 Third Quarter 177,718,000 46,764,000 1.188,000 .05 Fourth Quarter 203,724,000 52,741,000 2.587,000 .10 $ 700,729,000 $ 181,457,000 $ 8.219,000 $.33 Fiscal year ended February 3, 1985: First Quarter $ 95,872,000 $ 25.026,000 $ 3.437,000 $.14 Second Quarter 119,068,000 29,185,000 3.808,000 .15 Third Quarter 100,459,000 27.658,000 3.280,000 .13 Fourth Quarter 117,380.000 32.450,000 3.597,000 .14 $ 432,779.000 $ 114.319,000 $ 14,122,000 $.56 AUDITORS' REPORT The Board of Directors and Stockholders, The Home Depot, Inc.: We have examined the consolidated balance sheets of The Home Depot, Inc. and subsidiary as of February 2, 1986 and February 3, 1985 and the related consolidated statements of earnings, stockholders' equity, and changes in financial position for each of the years in the three-year period ended February 2, 1986. Our examinations were made in accordance with generally accepted auditing standards, and, accordingly, included such tests of the accounting records and such other auditing procedures as we considered necessary in the circumstances. In our opinion, the aforementioned consolidated financial statements present fairly the financial position of The Home Depot, Inc. and subsidiary at February 2, 1986 and February 3, 1985, and the results of their operations and the changes in their financial position for each of the years in the three- year period ended February 2, 1986, in conformity with generally accepted accounting principles applied on a consistent basis. PEAT, MARWICK, MITCHELL & CO. Atlanta, Georgia March 24, 1986The Home Depot, Inc. 188-148 The Home Depot's strategy was successful in fueling an impressive growth in the company's operations. The first three Home Depot stores, opened in Atlanta in 1979, were a quick success. From this modest beginning, the company grew rapidly and went public in 1981. The company's stock initially traded over-the-counter and was listed on the New York Stock Exchange in April 1984. Several new stores were opened in markets throughout the sunbelt and the number of stores operated by The Home Depot grew from 3 in 1979 to 50 by the end of fiscal 1985. As a result, sales grew from $7 million in 1979 to $700 million in 1985. Exhibit 1 provides a summary of the growth in the company's operations. The company's stock price performance during 1985 is summarized in Exhibit 2. Industry and Competition The home improvement industry was large and growing during the 1980s. The industry sales totaled approximately $80 billion in 1985 and strong industry growth was expected to continue, especially in the do-it-yourself (DIY) segment, which had grown at a compounded annual rate of 14% over the last 15 years. With the number of two-wage-earner households growing, there was an increase in families' average disposable income, making it possible to increase the frequency and magnitude of home improvement projects. Further, many homeowners were undertaking these projects by themselves rather than hiring a contractor. Research conducted by the Do-It-Yourself Institute, an industry trade group, showed that DIY activities had become America's second most popular leisure-time activity after watching television. The success of warehouse retailing pioneered by The Home Depot attracted a number of other companies into the industry. Among the store chains currently operating in the industry were Builders Square (a division of K Mart), Mr. HOW (a division of Service Merchandise), The Home Club (a division of Zayre Corp.), Payless Cashways (a division of W.K. Grace), and Hechinger Co. Most of these store chains were relatively new and not yet achieving significant profitability. Among The Home Depot's competitors, the most successful was Hechinger, which had operated hardware stores for a long time and recently entered the do-it-yourself segment of the industry. Using a strategy quite different from The Home Depot's, Hechinger ran gleaming upscale stores and aimed at high profit margins. As of the end of fiscal 1985, the company operated 55 stores, located primarily in southeastern states. Hechinger announced that it planned to expand its sales by 20 to 25% a year by adding 10 to 14 stores a year. A summary of Hechinger's recent financial performance is presented in Exhibit 3. The Home Depot's Future While The Home Depot had achieved rapid growth every year since its inception, fiscal 1985 was probably the most important in the company's seven-year history. During 1985 the company implemented its most ambitious expansion plan to date by adding 20 new stores in eight new markets. Nine of these stores were acquired from Bowater, a competing store chain which was in financial difficulty. As The Home Depot engaged in major expansion, its revenues rose 62% from $432 million in fiscal 1984 to $700 million in 1985. However, the company's earnings declined in 1985 from the record levels achieved during the previous fiscal year. In fiscal 1985, The Home Depot earned $8.2 million, or $0.33 per share, as compared with $14.1 million or $0.56 per share in fiscal 1984. Bernard Marcus, The Home Depot's chairman and chief executive officer, commented on the company's performance as follows: Fiscal 1985 was a year of rapid expansion and continued growth for The Home Depot. Feeling the time was ripe for us to enhance our share of the do-it-yourself market, we\f\fExhibit 3 (continued) Summary of Financial Performance of Hechinger Company Part II: Hechinger's Cash Flow Year Ending (Dollars In Thousands) February 1, 1986 February 2, 1985 January 28, 1984 Cash Provided from Operations Net Earnings $23,111 $20,923 $16,243 Items not requiring the use of cash or marketable securities Depreciation and amortization 6,594 4,622 3,429 Deferred income taxes 1,375 2,040 1,515 Deferred rent expense 2.321 2,064 1,463 33,401 29,649 22.650 Cash Invested in Operations Accounts receivable 4.657 7,905 7.954 Merchandise inventories 17.908 B.045 20.596 Other current assets 4,801 3,760 1,304 Accounts payable and accrued expenses (6,620) (12,099) (9,767) Taxes on income-current 285 3,031 (575) 21,211 10,642 19,512 Net Cash Provided from Operations 12,190 19,007 3,138 Cash Used for Investment Activities Expenditures for property, furniture and equipment, net of disposals, and other (36,037) (25,531) (16,346) Cash Used to Pay Dividends to Shareholders (1,550) (1,091) (868) Cash Provided from Financing Activities Proceeds from public offering of 8 1/2% Converted Subordinated Debentures, net of expenses 85,010 Proceeds from public offering of common stock net of expenses 28.969 13.439 Proceeds from sale and leaseback transactions under operating leases 8,338 6.874 Increase (decrease) in long-term debt (4,750) 6,366 Decrease in short-term debt (318) Exercise of stock options including income tax benefit 180 574 611 Decrease in capital lease obligations (311) (280) (254) 28,838 88,992 26,718 Increase in Cash and Marketable Securities $ 3,441 $ 81,377 $ 12,642Exhibit 4 Abridged Annual Report for Fiscal Year 1985 A Letter to Our Shareholders: Fiscal 1985 was a year of rapid expansion and Despite our significant investments, we still continued growth for The Home Depot. continue to be in a very strong financial Feeling the time was ripe for us to enhance condition. In December, The Home Depot our share of the do-it-yourself market, we replaced a prior $100 million bank credit line seized the opportunity to make a significant with an eight-year decreasing revolving credit investment in our long-term future. At the agreement of $200 million. In addition, we are same time, we recognized that our short-term pursuing sale-and-leaseback negotiations for profit growth would be affected. an aggregate of approximately $50 million for ten of our stores. These sources of additional The Home Depot intends to be the dominant funds, along with internally generated cash factor in every market we serve. The key to flow, will provide us with an ample financial our success has been that upon entering a new foundation to continue to underwrite our market, we make a substantial commitment- growth over the next several years. opening multiple stores, providing excellent customer service, creating highly visible We are also quite proud that The Home Depot promotions, and growing the entire market. achieved its substantial gain in sales and We turn the novice into a do-it-yourselfer and market share in what turned out to be a very enable the expert to do more for less money- difficult year for our industry and retailing in general. The do-it-yourself "warehouse" From shortly before the end of fiscal 1984 to industry, which we pioneered only a few short the close of fiscal 1985, The Home Depot years ago, has recently attracted many entered eight new markets-Dallas, Houston, competitors, some of whom have already Jacksonville, San Diego, Los Angeles, fallen by the wayside, having mistaken our Shreveport, Baton Rouge and Mobile-in a dramatic success as a path towards easy period of approximately 13 months. In that profits. Now the industry is faced with a time, the number of Home Depot stores rose situation when only the strongest and most dramatically, from 22 to 50, including 9 stores capable will survive. As this process acquired in the Bowater acquisition which had continues, we expect to encounter additional not been in our original plan. Twenty of these cost competition in the fight for market stores were opened during the past fiscal year dominance. However, with our strengths- alone. During this time span, we have become both financial and our successful ability to the only national warehouse retailing chain develop a loyal customer base-we are serving markets across the Sunbelt. confident that The Home Depot will emerge an even stronger company. This expansion program required a tremendous investment of capital We have never doubted The Home Depot's expenditures and inventory, as well as in ability to be a leader in our business. We have personnel. As a result, our net earnings the market dominance, the superior retailing declined from record levels achieved during concepts and the necessary foundation of the previous fiscal year. In fiscal 1985, The experienced management. Further, we have Home Depot earned $8,219,000, or $.33 per the determination to maintain our position. share, as compared with $14,122,000, or $.56 per share, in fiscal 1984. However, as The Looking at some of our markets individually, Home Depot engaged in this major thrust clearly our most difficult environment has forward, it also increased its market share and been in Houston, where the oil-related market presence as revenues rose 62% from economy is undergoing painful contractions $432,779,000 in fiscal 1984 to $700,729,000 in combined with particularly fierce industry fiscal 1985. competition. This has caused our newly
Step by Step Solution
There are 3 Steps involved in it

Get step-by-step solutions from verified subject matter experts