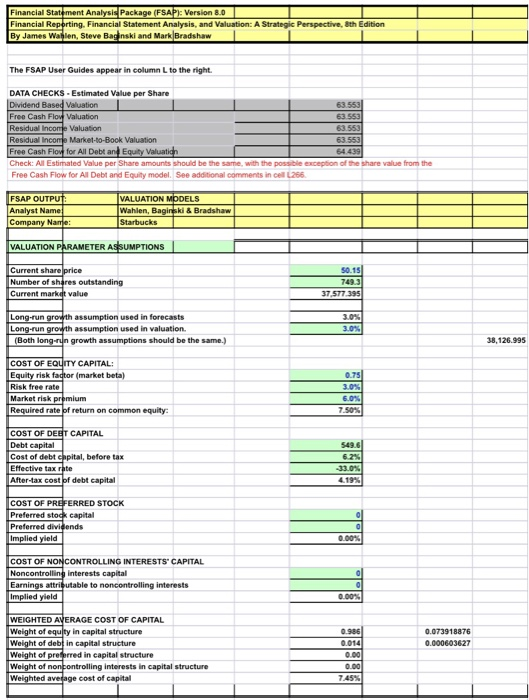
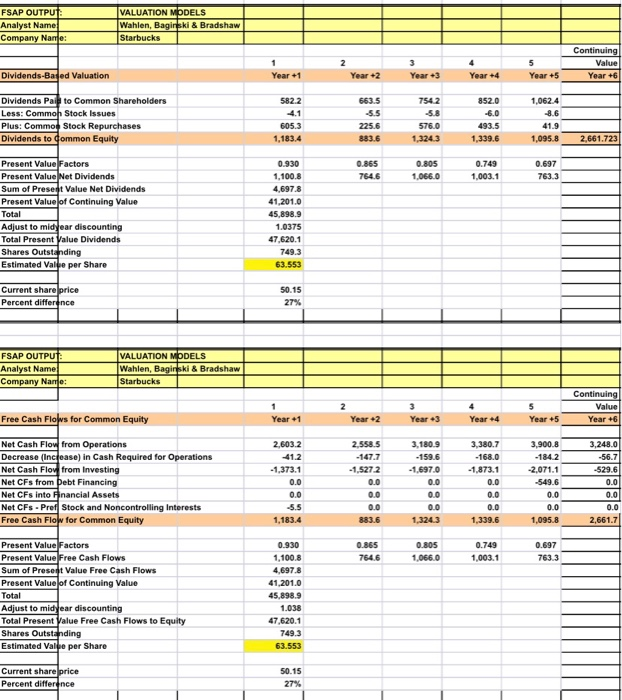
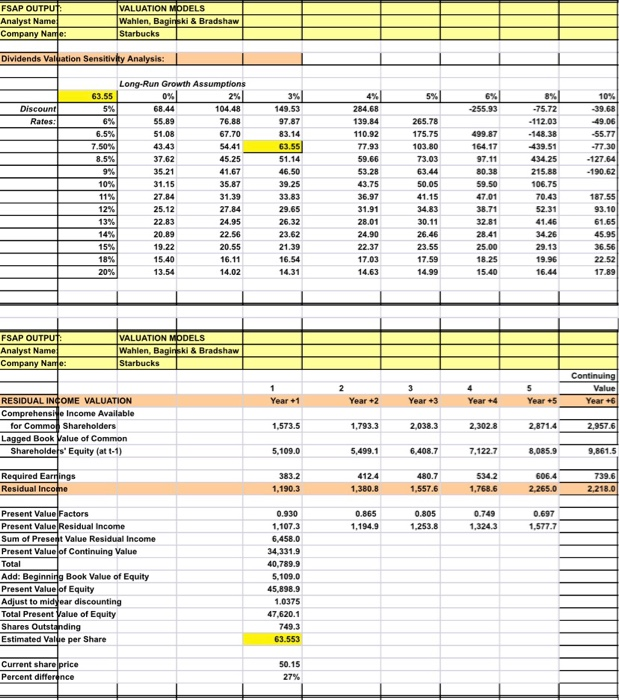
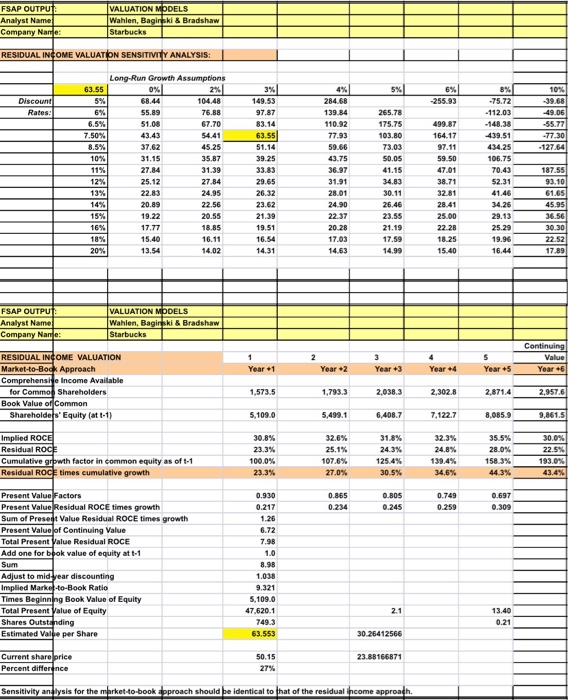
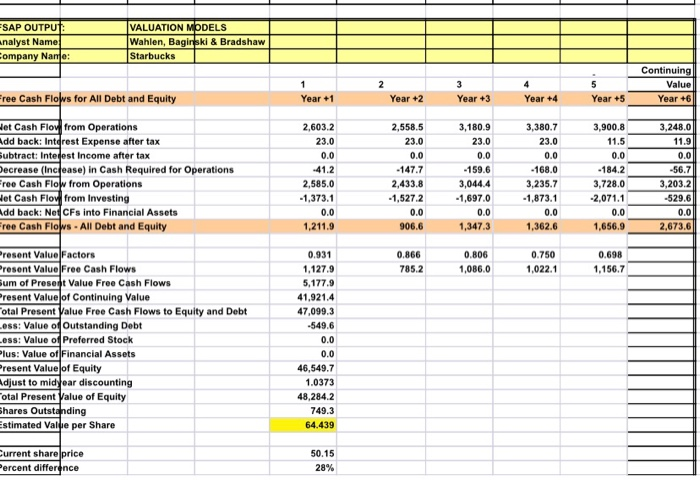
In the parameters, as an analyst, what are the most important variables and why? Are dividends an important variable in the valuation of Starbucks?
I: Version 8.0 Reporting. Financial Statement Analysis, and Valuation: A Strategic Perspective, 8th Edition dshaw The FSAP User Guides appear in column Lto the right DATA CHECKS Estimated Value per Share Dividend Based Valuation Free Cash Flow Valuation Residual Income Valuation 63 63.553 63 Market-to-Book Valuation Free Cash Flow for All Debt and Equity Check: All Estimated Value per Share amounts should be the same, with the possible exception of the share value from the Free Cash Flow for All Debt and Equity model. See additional comments in cell L266 FSAP OUTPU VALUATION Analyst Name Wahien, Baginski & Bradshaw VALUATION PhRAMETER A UMPTIONS Current share price Number of shares outstanding 50.15 749.3 37,577 395 assumption used in forecasts 3.0% ong-run groth assumption used in valuation. Both long-growth assumptions should be the same.) 38,126.995 COST OF EQUITY CAPITAL: Equity risk fator (market beta) 0.75 Risk free rate Market risk premium Required rate of return on common equity 750% COST OF DE CAPITAL Cost of debt cnpital, before tax Effective tax rate After-tax cost of debt capital 549.6 6.2% 410% 419% COST OF PREFERRED STOCK Preferred stock capital Preferred dividends 000% COST OF NONCONTROLLING INTERESTS" CAPITAL Noncontrolling interests capital Earnings attributable to noncontrolling interests 0.00% WEIGHTED AVERAGE COST OF CAPITAL Weight of equty in capital structure Weight of debt in capital structure 0.986 0.014 0.00 0.00 745% 0.073918876 0.000603627 Weight of preprred in capital structure Weight of no ing interests in capital structure Weighted average cost of capital FSAP OUTPU Analyst Name Company Name VALUATION Wahlen, Baginski & Bradshaw Continuing Value Year +6 Year +1 Year +2 Year +5 1,062.4 41.9 Dividends-Based Valuation Year +3 Year +4 582.2 Dividends Paid to Common Shareholders Less: Common Stock Issues Plus: Common Stock Repurchases 663.5 5.5 225.6 852.0 605.3 576.0 493.5 1,339.6 Dividends to Common Equity 1,1834 1,095.8 2,661.723 0.697 763.3 Present Value Factors Present Value Net Dividends Sum of Present Value Net Dividends Present Value of Continuing Value Total Adjust to midyear discounting Total Present Value Dividends Shares Outstnding Estimated 0.930 1,100.8 4,697.8 41,201.0 45,898.9 1.0375 47,620.1 749.3 63.553 0.865 0.805 0.749 64.61,066.0 ,003.1 albe per Share Current share price Percent difference 50.15 FSAP OUTPU Analyst Name Company Name VALUATION ki & Bradshaw Starbucks Continuing Free Cash Flows for Common Equity Year +1 Year +2 Year +3 Year +4 Year +5 Year +6 Net Cash Flo from Operations Decrease (Inc ease) in Cash Required for Operations Net Cash Flov from Investing Net CFs from Debt Financing Net CFs into Financial Assets Net CFs-Pref Stock and Noncontrolling Interests Free Cash Flow for Common Equity 2,603.2 41.2 -1,373.1 147.7 1,527.2 3,180.9 159.6 -168.0 1,873.1 0.0 3,248.0 56.7 529.6 184.2 -1.697.0 549.6 5.5 1,183.4 1,095.8 2,661.7 0.697- 763.3 0.930 1,1008 4,697.8 41,201.0 45,898.9 1.038 47,620.1 749.3 63.553 0.805 Present Valuel Factors Present Value Free Cash Flows Sum of Present Value Free Cash Flows Present Valueof Continuing Value Total Adjust to midyear discounting Total Present Value Free Cash Flows to Equity Shares Outstanding Estimated Val e per Share 0.749 7646 1,061.003.1 1,066.0 1,003.1 Current share 50.15 Percent diffe FSAP OUTPU VALUATION Wahlen, Baginski & Bradshaw Dividends Valpation Sensitivity Analysis: Long-Run Growth Assumptions 265.78 175.75 103.80 -112.03 148.38 55.77 164.17 -127.64 -190.62 46.50 50.05 27.84 47.01 70.43 34.83 26.32 20.89 25.00 FSAP OUTPU VALUATION MODELS ki & Bradshaw Company Name: Starbucks Value RESIDUAL INOME VALUATION Comprehensi e Income Available Year +2 Year +5 1,793.32,038.3 2,302.82,8714 5,499.16,408.7 7,122.78,085.9 Year +6 for Commo Shareholders Lagged Book Value of Common 2,957.6 Shareholders Equity (at t-1) 9,861.5 Required Earrings Residual Income 480.7 534.2 606.4 739.6 2,218.0 1,190.3 Present Value Factors Present Value Residual Income Sum of Preset Value Residual Income Present Value of Continuing Value ,194.91253.832431,577. 34,331.9 40,789.9 Add: Beginning Book Value of Equity Present Value of Equity Adjust to Total Present Value of Equity 45,898.9 1.0375 47,620.1 Estimated Value per Share Percent differ nce VALUATION Company Na RESIDUAL INCOME VALUATON S ENSmvtr ANALYSIS Long-Run Growth Assumptions i& Bradshaw RESIDUAL INCOME VALUATION Year2 Year +6 ,793.3 2,038.32,302.8 2,8714 Shareholders Equity (at t-1 ith factor in common equity as of t-1 125.4% 158.3% Residual ROCE times cumulative growth Present Value Residual ROCE times growth Sum of Present Value Residual ROCE times growth Present Value of Continuing Value Total Present Value Residual ROCE Add one for book value of equity at t-1 Implied Market-to-Book Ratio Times Beginn Toa en Value of Eguity 13.40 0.26412566 23.88166871 SAP OUTPU nalyst Name ompany Name VALUATION MODELS Wahlen, Baginski & Bradshaw Starbucks Value Year +6 ree Cash Flows for All Debt and Equity Year +1 Year +2 Year +3 Year +4 Year +5 2,558.5 3,180.9330.7 3,900.8 3,248.0 et Cash Flov from Operations dd back: Intdrest Expense after tax ubtract: Intedest Income after tax ecrease (Increase) in Cash Required for Operations ree Cash Flow from Operations et Cash Flov from Investing dd back: Net CFs into Financial Assets ree Cash Flows All Debt and Equity 2,603.2 23.0 23.0 0.0 168.0 3,235.7 23.0 23.0 0.0 159.6 3,044.4 1,697.0 11.5 41.2 2,585.0 -147.7 2,433.8 1,527 2 0.0 906.6 184.2 3,728.0 2,071.1 56.7 3,203.2 529.6 1,373. 1,873. 0.0 1,362.6 1,211.9 1,347.3 1,656.9 2,673.6 0.698 1,156.7 0.931 ,127.9 5,177.9 41,921.4 47,099.3 549.6 resent Value Factors resent Value Free Cash Flows um of Present Value Free Cash Flows 0.866 785.2 0.806 1,086.0 0.750 ,022.1 Present Value of Continuing Value otal Present Value Free Cash Flows to Equity and Debt ess: Value of Outstanding Debt ess: Value of Preferred Stock lus: Value of Financial Assets Present Value of Equity djust to midyear discounting otal Present Vale of Equity hares Outstanding stimated Valbe per Share 46,549.7 .0373 48,284.2 749.3 64.439 urrent share price 50.15 28% ercent difference
