Answered step by step
Verified Expert Solution
Question
1 Approved Answer
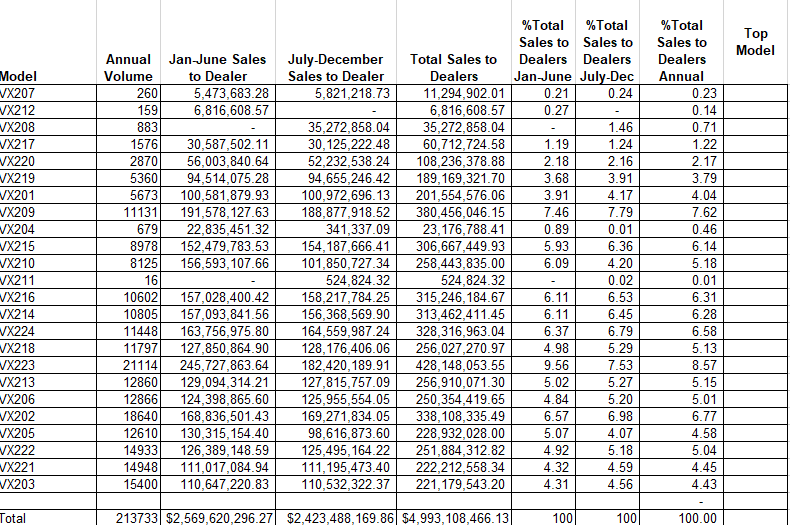
In the Summary sheet, create a new column to the right of %Total Sales to Dealers Annual. Name it Top Model?. Format this column to

In the Summary sheet, create a new column to the right of %Total Sales to Dealers Annual. Name it Top Model?. Format this column to have borders that match the rest of the table. Use a function to display TOP for each model that has a % of total sales greater than the average of the % total sales for all models.
Top Model July-December Sales to Dealer 5,821,218.73 Model VX207 VX212 VX208 VX217 VX220 VX219 VX201 VX209 VX204 VX215 VX210 VX211 VX216 VX214 VX224 VX218 VX223 VX213 VX206 VX202 VX205 VX222 VX221 VX203 Annual Jan-June Sales Volume to Dealer 260 5,473,683.28 159 6,816,608.57 883 1576 30,587,502.11 2870 56,003,840.64 5360 94,514,075.28 5673 100,581,879.93 11131 191,578,127.63 679 22,835,451.32 8978 152,479,783.53 8125 156,593, 107.66 16 10602 157,028,400.42 10805 157,093,841.56 11448 163,756,975.80 11797 127,850,864.90 21114 245,727,863.64 12860 129,094,314.21 12866 124,398,865.60 18640 168,836,501.43 12610 130,315, 154.40 14933 126,389,148.59 14948 111,017,084.94 15400 110,647,220.83 35,272,858.04 30,125,222.48 52,232,538.24 94,655,246.42 100,972,696.13 188,877,918.52 341,337.09 154,187,666.41 101,850,727.34 524,824.32 158,217,784.25 156,368,569.90 164,559,987.24 128, 176,406.06 182,420,189.91 127,815,757.09 125,955,554.05 169,271,834.05 98,616,873.60 125,495,164.22 111,195,473.40 110,532,322.37 %Total %Total Sales to Sales to Total Sales to Dealers Dealers Dealers Jan-June July-Dec 11,294,902.01 0.21 0.24 6,816,608.57 0.27 35,272,858.04 1.46 60,712,724.58 1.19 1.24 108,236,378.88 2.18 2.16 189,169,321.70 3.68 3.91 201,554,576.06 3.91 4.17 380,456,046.15 7.46 7.79 23,176,788.41 0.89 0.01 306,667,449.93 5.93 6.36 258,443,835.00 6.09 4.20 524,824.32 0.02 315,246,184.67 6.11 6.53 313,462,411.45 6.11 6.45 328,316,963.04 6.37 6.79 256,027,270.97 4.98 5.29 428, 148,053.55 9.56 7.53 256,910,071.30 5.02 5.27 250,354,419.65 4.84 5.20 338, 108,335.49 6.57 6.98 228,932,028.00 5.07 4.07 251,884,312.82 4.92 5.18 222,212,558.34 4.32 4.59 221,179,543.20 4.31 4.56 % Total Sales to Dealers Annual 0.23 0.14 0.71 1.22 2.17 3.79 4.04 7.62 0.46 6.14 5.18 0.01 6.31 6.28 6.58 5.13 8.57 5.15 5.01 6.77 4.58 5.04 4.45 4.43 Total 213733 $2,569,620,296.27 $2,423,488, 169.86 $4,993, 108,466.13 100 100 100.00 Top Model July-December Sales to Dealer 5,821,218.73 Model VX207 VX212 VX208 VX217 VX220 VX219 VX201 VX209 VX204 VX215 VX210 VX211 VX216 VX214 VX224 VX218 VX223 VX213 VX206 VX202 VX205 VX222 VX221 VX203 Annual Jan-June Sales Volume to Dealer 260 5,473,683.28 159 6,816,608.57 883 1576 30,587,502.11 2870 56,003,840.64 5360 94,514,075.28 5673 100,581,879.93 11131 191,578,127.63 679 22,835,451.32 8978 152,479,783.53 8125 156,593, 107.66 16 10602 157,028,400.42 10805 157,093,841.56 11448 163,756,975.80 11797 127,850,864.90 21114 245,727,863.64 12860 129,094,314.21 12866 124,398,865.60 18640 168,836,501.43 12610 130,315, 154.40 14933 126,389,148.59 14948 111,017,084.94 15400 110,647,220.83 35,272,858.04 30,125,222.48 52,232,538.24 94,655,246.42 100,972,696.13 188,877,918.52 341,337.09 154,187,666.41 101,850,727.34 524,824.32 158,217,784.25 156,368,569.90 164,559,987.24 128, 176,406.06 182,420,189.91 127,815,757.09 125,955,554.05 169,271,834.05 98,616,873.60 125,495,164.22 111,195,473.40 110,532,322.37 %Total %Total Sales to Sales to Total Sales to Dealers Dealers Dealers Jan-June July-Dec 11,294,902.01 0.21 0.24 6,816,608.57 0.27 35,272,858.04 1.46 60,712,724.58 1.19 1.24 108,236,378.88 2.18 2.16 189,169,321.70 3.68 3.91 201,554,576.06 3.91 4.17 380,456,046.15 7.46 7.79 23,176,788.41 0.89 0.01 306,667,449.93 5.93 6.36 258,443,835.00 6.09 4.20 524,824.32 0.02 315,246,184.67 6.11 6.53 313,462,411.45 6.11 6.45 328,316,963.04 6.37 6.79 256,027,270.97 4.98 5.29 428, 148,053.55 9.56 7.53 256,910,071.30 5.02 5.27 250,354,419.65 4.84 5.20 338, 108,335.49 6.57 6.98 228,932,028.00 5.07 4.07 251,884,312.82 4.92 5.18 222,212,558.34 4.32 4.59 221,179,543.20 4.31 4.56 % Total Sales to Dealers Annual 0.23 0.14 0.71 1.22 2.17 3.79 4.04 7.62 0.46 6.14 5.18 0.01 6.31 6.28 6.58 5.13 8.57 5.15 5.01 6.77 4.58 5.04 4.45 4.43 Total 213733 $2,569,620,296.27 $2,423,488, 169.86 $4,993, 108,466.13 100 100 100.00
Step by Step Solution
There are 3 Steps involved in it
Step: 1

Get Instant Access to Expert-Tailored Solutions
See step-by-step solutions with expert insights and AI powered tools for academic success
Step: 2

Step: 3

Ace Your Homework with AI
Get the answers you need in no time with our AI-driven, step-by-step assistance
Get Started


