

Question
In these steps, you need to prepare some charts showing trends in the sporting goods industry. A workbook containing a variety of information on industry-wide
 In these steps, you need to prepare some charts showing trends in the sporting goods industry. A workbook containing a variety of information on industry-wide trends has already been created. You will begin with data showing the number of people who participate in a variety of sports and activities.
1-
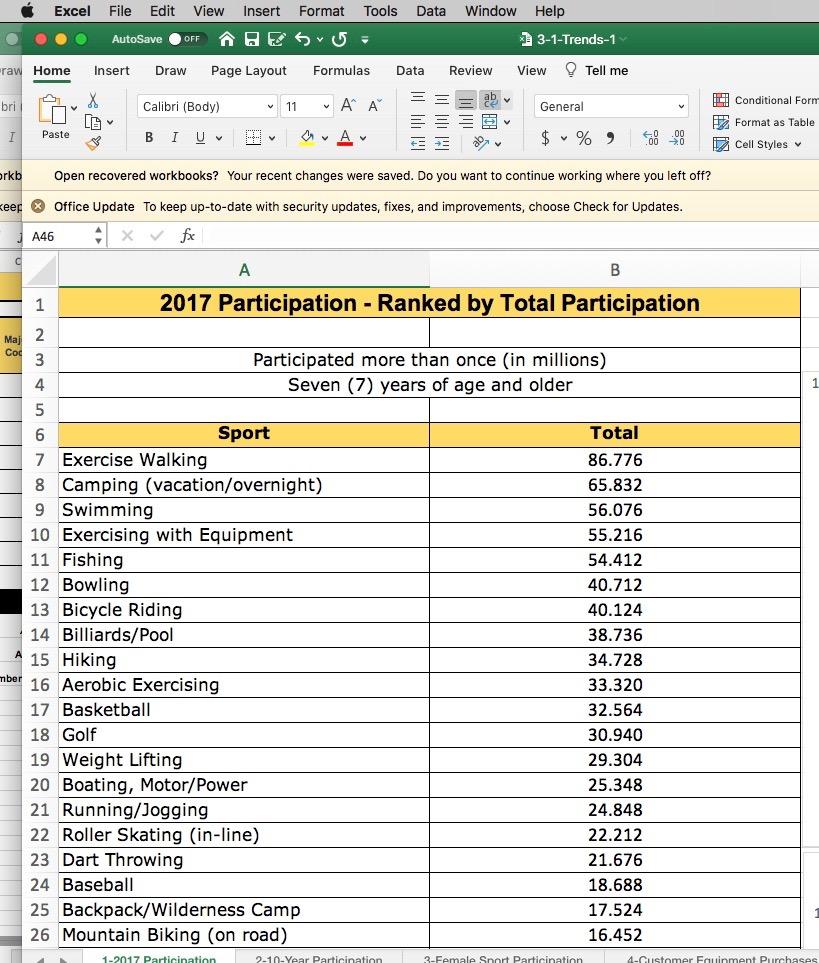
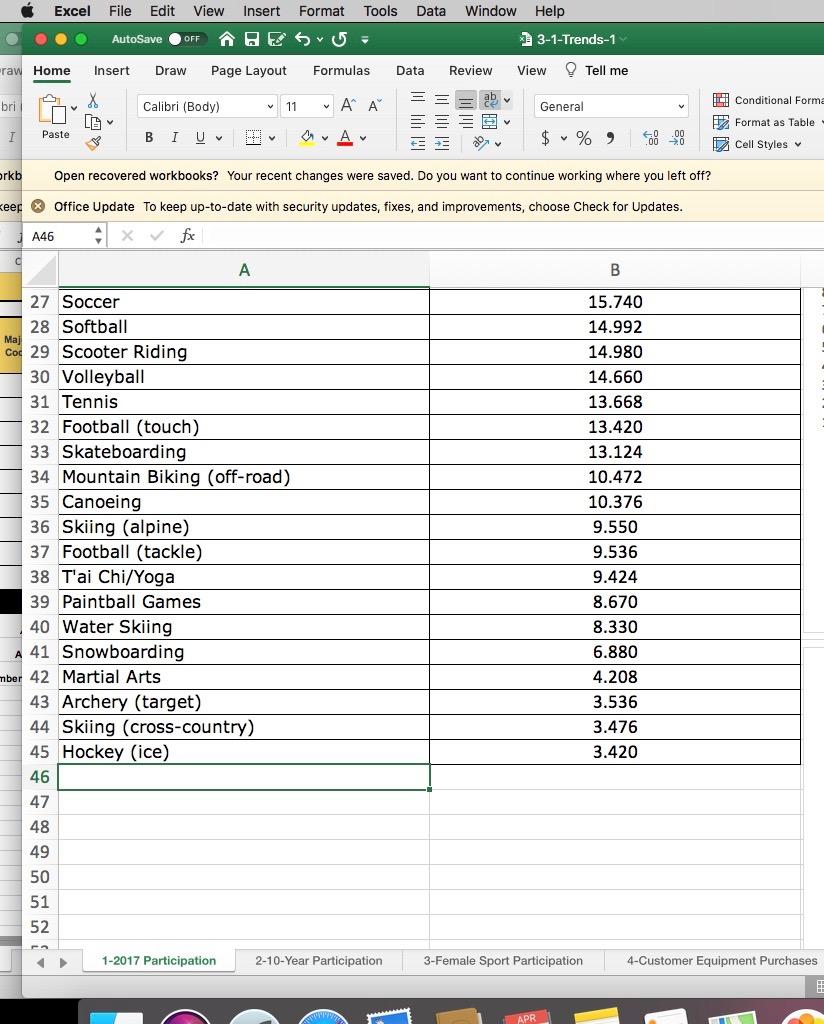
The 2017 Participation worksheet contains participation data for a variety of sports, ranked in descending order by the values in the Total column.
-
Create a column chart, a bar chart, and a line chart from the data. Place each chart on the same worksheet as the source data.
-
b) In an area below each chart, explain what the chart type emphasizes about thedata. Decide which chart is the best choice for comparing each sports participation level
-
d) Return to the 2017 Participation worksheet, and in an area below the chart you selected to place on the chart sheet, explain the advantages and any disadvantages of this chart.
Step by Step Solution
There are 3 Steps involved in it
Step: 1

Get Instant Access to Expert-Tailored Solutions
See step-by-step solutions with expert insights and AI powered tools for academic success
Step: 2

Step: 3
Ace Your Homework with AI
Get the answers you need in no time with our AI-driven, step-by-step assistance
Get Started
Detecting Accounting Fraud Before Its Too Late
Authors: Oriol Amat
1st Edition
1119566843, 9781119566847