

Question
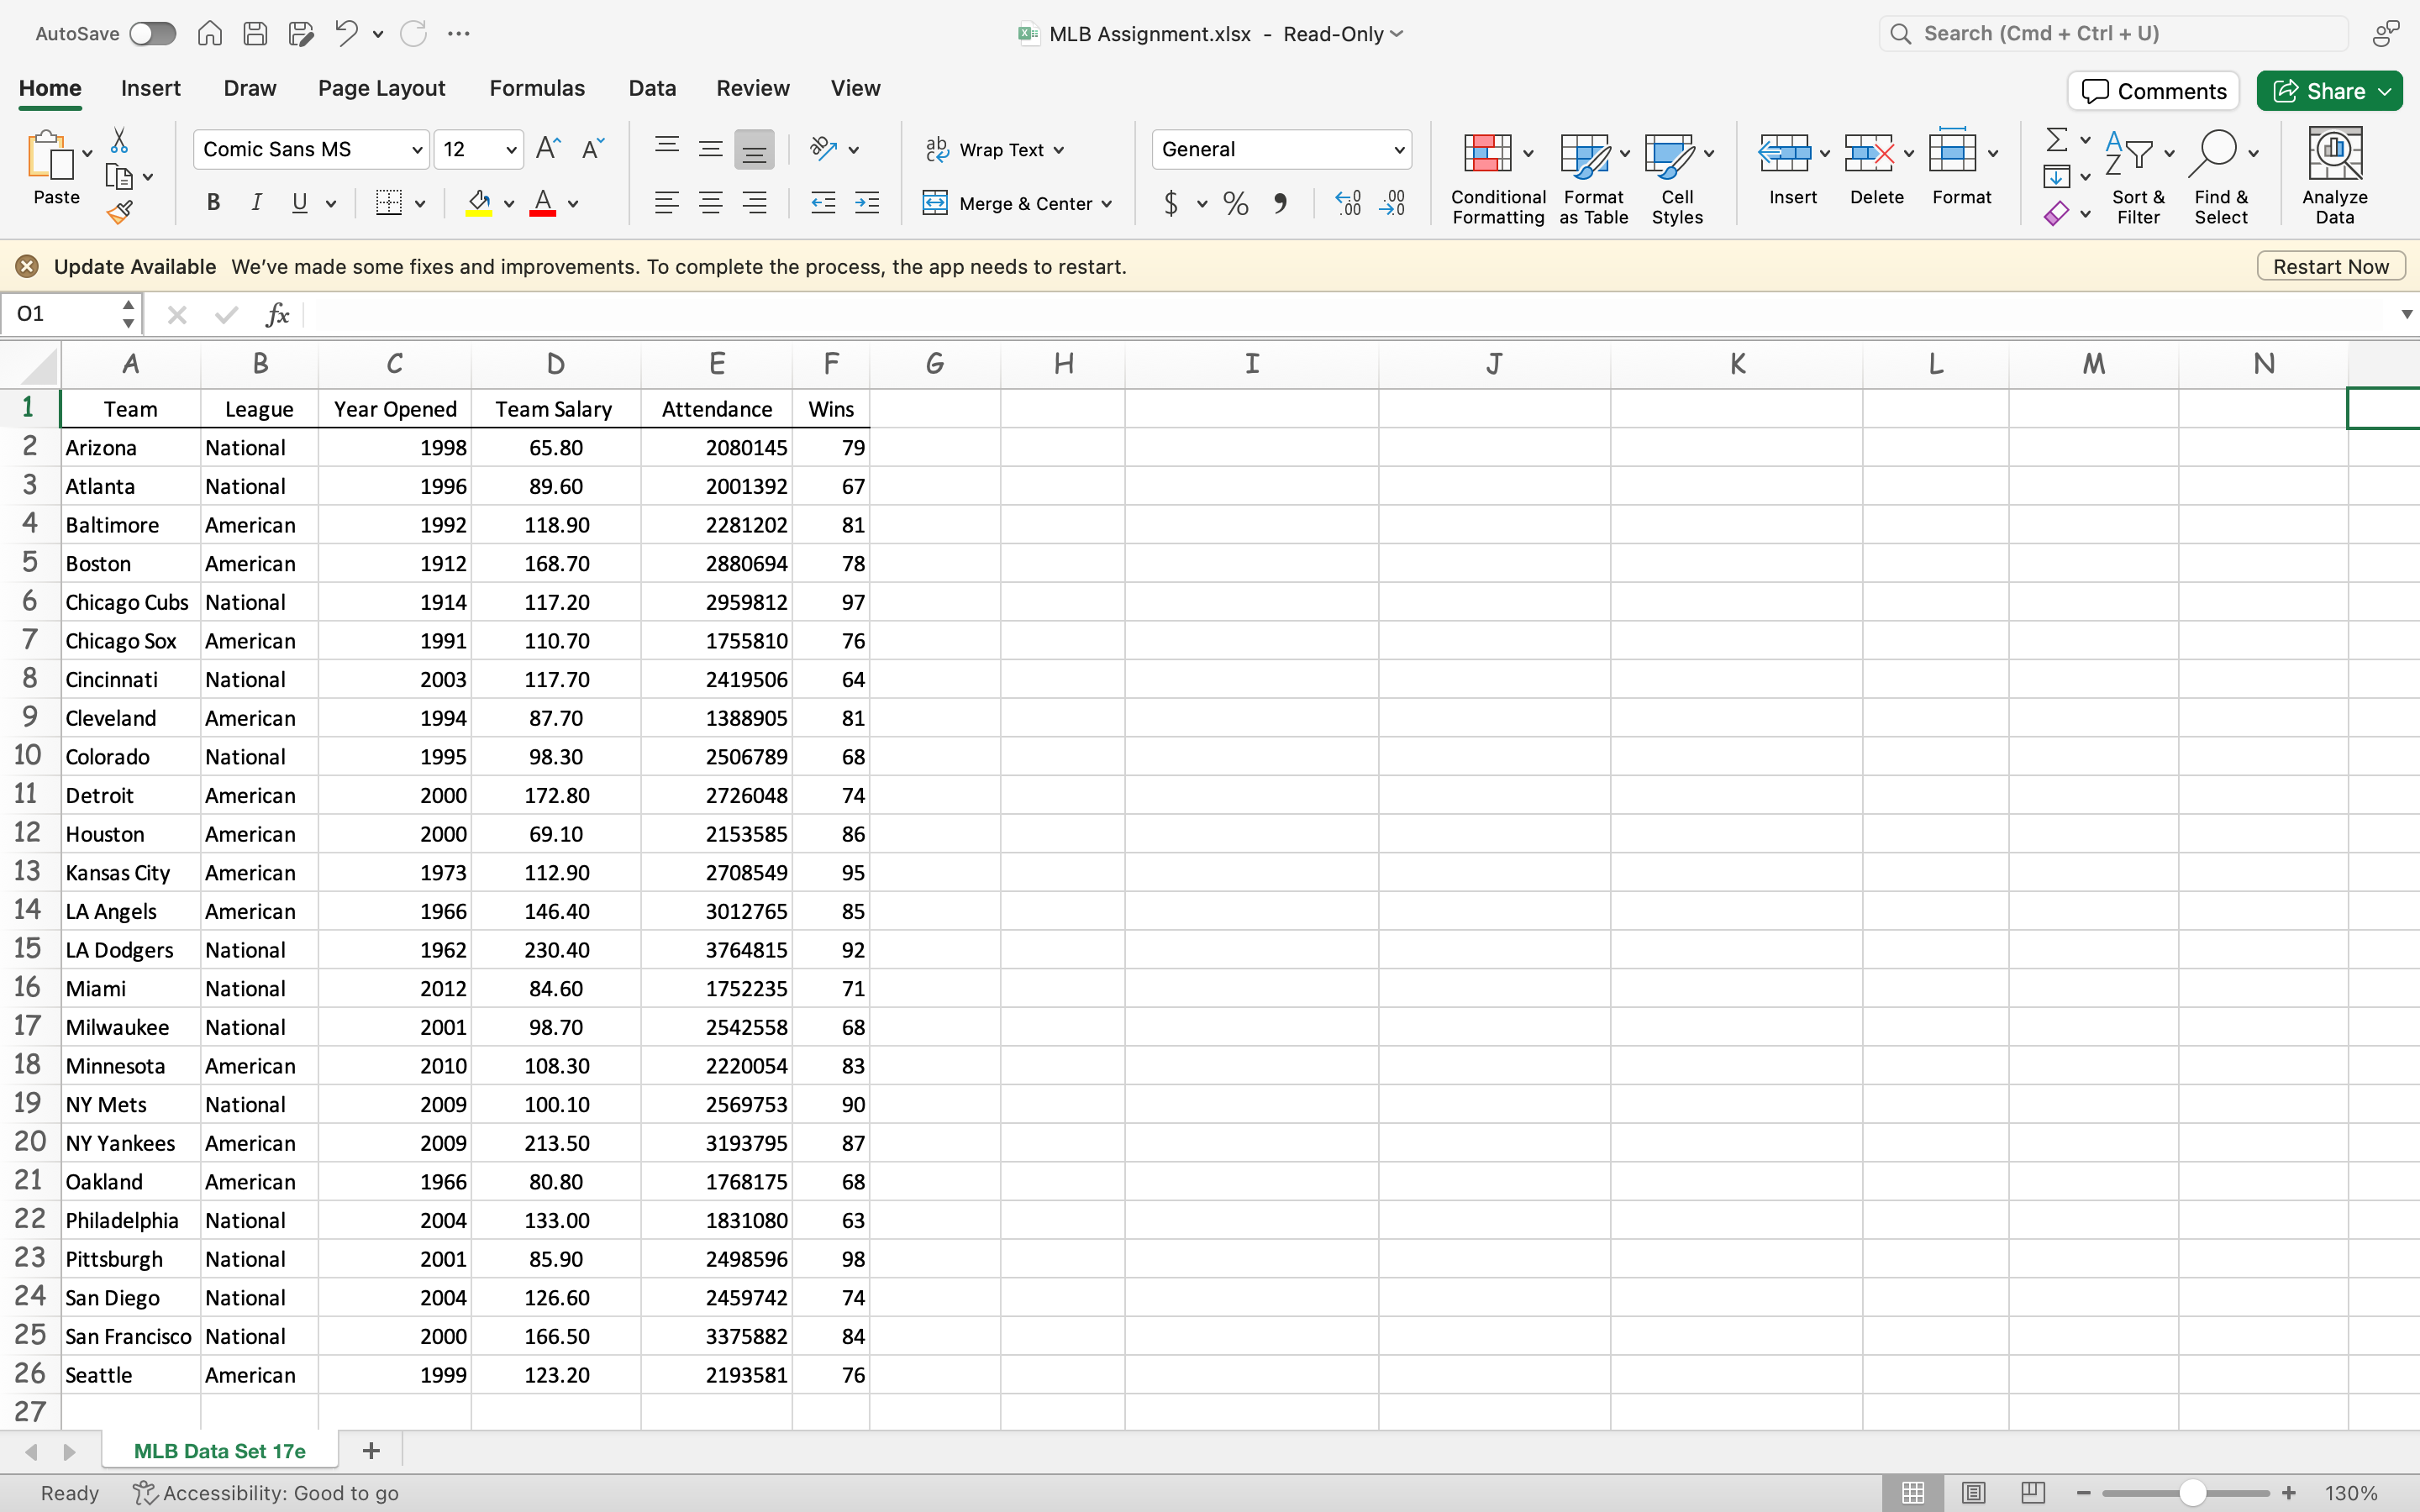
In this assignment the MLB association has hired you as a consultant. They want you to analyze data regarding the earnings index for relevant teams.
In this assignment the MLB association has hired you as a consultant. They want you to analyze data regarding the earnings index for relevant teams. You should give your prospective outlook for the teams.
A. Use Excel to calculate the mean, median and mode for salary, attendance, and wins. Then, make a histogram for each variable and discuss skewness. Display and discuss this information in your PowerPoint.
B. Use the rule of 2? to generate a frequency table for salary, attendance, and wins. Do a relative frequency table and a pie graph for those variables as well. Which class has the largest frequency? Which class has the smallest frequency? Display and discuss this information in your PowerPoint.
C. Do a scatter plot between salary and attendance as well as salary and wins. Is there a direct or indirect relationship between salary and attendance? What about the relationship between salary and the number of wins? What are the correlation coefficients? Display and discuss this information in your PowerPoint.
D. Calculate the standard error for salary, using the formula in your textbook, with the appropriate sample size adjustments. Then, calculate a confidence interval around the mean associated with an alpha of 0.05, 0.10 and 0.32. Explain in each case how confident you are that the mean falls in that interval. Display and discuss this information in your PowerPoint.
E. Conclude your presentation with a short write up using the scientific method. You will want to determine the critical values for a two tailed hypothesis test for the 95%, 90% and 68% levels of confidence for salary, attendance, and wins. Display and discuss this information for each variable on a separate slide.
1. Is the mean sample mean for salary, attendance, and wins significantly different from the population mean for salary, attendance, and wins? (Note: the population mean for team salary is 175, the population mean for attendance is 2758667, and the population mean for wins is 95.) What was/were the testable hypothesis(es) from the data?
2. What statistic did you use (t-stat or z-score) and why?
3. Did you reject the hypothesis(es) or fail to reject the hypothesis(es) at the 95%, 90% and 68% levels of confidence?
4. Compute 2 regressions in Excel with salary as the dependent variable. Explain the relationship between salary and attendance as well as the relationship between salary and wins. Are the slope coefficients significant at the 95% level of confidence? How well is the variation in the dependent variable explained?
5. What inference can be safely drawn from your hypothesis testing? Specifically, would you advise the MLB association to do in the future?
Step by Step Solution
There are 3 Steps involved in it
Step: 1

Get Instant Access to Expert-Tailored Solutions
See step-by-step solutions with expert insights and AI powered tools for academic success
Step: 2

Step: 3
Ace Your Homework with AI
Get the answers you need in no time with our AI-driven, step-by-step assistance
Get Started
Probability and Stochastic Processes A Friendly Introduction for Electrical and Computer Engineers
Authors: Roy D. Yates, David J. Goodman
3rd edition
1118324560, 978-1118324561