Answered step by step
Verified Expert Solution
Link Copied!

Question

1 Approved Answer

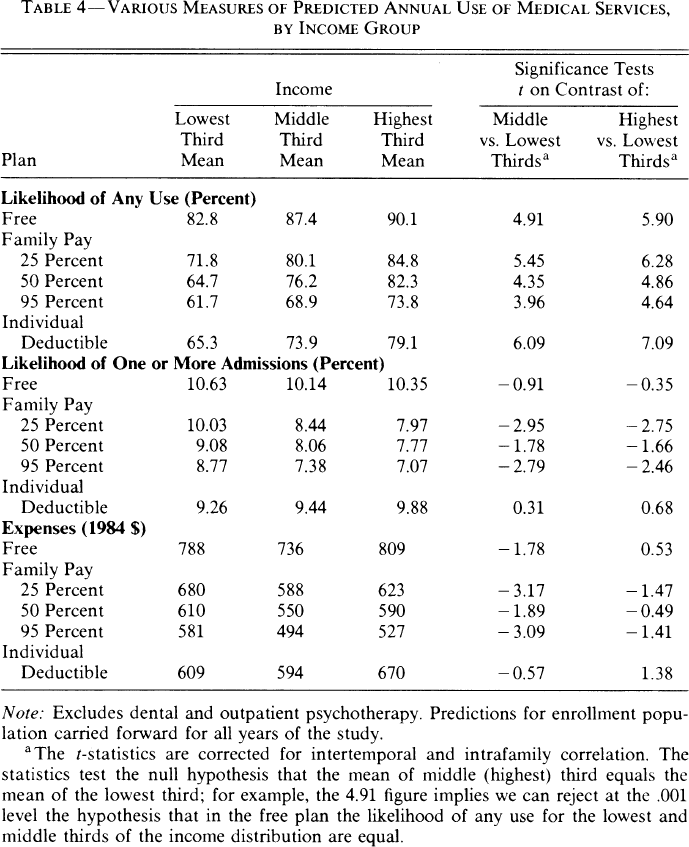
In this exercise, assume that the term admission refers to inpatient care, while any use refers to inpatient and outpatient care. The table below contains

In this exercise, assume that the term "admission" refers to inpatient care, while "any use" refers to inpatient and outpatient care. The table below contains a lot of information. Without looking at any specific values, summarize what TYPE of data the table contains.

1. Give an example of a broad question about income levels and demand for health care that the table might have the potential to answer.

image text in transcribedimage text in transcribed
TABLE 4- VARIOUS MEASURES OF PREDICTED ANNUAL USE OF MEDICAL SERVICES, BY INCOME GROUP Significance Tests Income I on Contrast of: Lowest Middle Highest Middle Highest Third Third Third vs. Lowest vs. Lowest Plan Mean Mean Mean Thirdsa Thirdsa Likelihood of Any Use (Percent) Free 82.8 87.4 90.1 4.91 5.90 Family Pay 25 Percent 71.8 80.1 84.8 5.45 6.28 50 Percent 64.7 76.2 82.3 4.35 4.86 95 Percent 61.7 68.9 73.8 3.96 4.64 Individual Deductible 65.3 73.9 79.1 6.09 7.09 Likelihood of One or More Admissions (Percent) Free 10.63 10.14 10.35 - 0.91 - 0.35 Family Pay 25 Percent 10.03 8.44 7.97 - 2.95 - 2.75 50 Percent 9.08 8.06 7.77 - 1.78 - 1.66 95 Percent 8.77 7.38 7.07 - 2.79 - 2.46 Individual Deductible 9.26 9.44 9.88 0.31 0.68 Expenses (1984 $) Free 788 736 809 - 1.78 0.53 Family Pay 25 Percent 680 588 623 - 3.17 - 1.47 50 Percent 610 550 590 - 1.89 - 0.49 95 Percent 581 494 527 - 3.09 - 1.41 Individual Deductible 609 594 670 -0.57 1.38 Note: Excludes dental and outpatient psychotherapy. Predictions for enrollment popu- lation carried forward for all years of the study. The t-statistics are corrected for intertemporal and intrafamily correlation. The statistics test the null hypothesis that the mean of middle (highest) third equals the mean of the lowest third; for example, the 4.91 figure implies we can reject at the .001 level the hypothesis that in the free plan the likelihood of any use for the lowest and middle thirds of the income distribution are equal.Table 3.2: Meal options in the Grossman model. Meal Home good {Z} Health (H) Steak and eggs +17 2 Kale salad with broccoli 2 +5 Entire box of cookies +10 2

Step by Step Solution

There are 3 Steps involved in it

Step: 1

blur-text-image

Get Instant Access to Expert-Tailored Solutions

See step-by-step solutions with expert insights and AI powered tools for academic success

Step: 2

blur-text-image

Step: 3

blur-text-image

Ace Your Homework with AI

Get the answers you need in no time with our AI-driven, step-by-step assistance

Get Started

Recommended Textbook for

Differential Equations A Maple™ Supplement

Authors: Robert P Gilbert, George C Hsiao, Robert J Ronkese

2nd Edition

1000402525, 9781000402520

More Books

Students also viewed these Mathematics questions

Question

2. What factors infl uence our perceptions?

Answered: 1 week ago

Question

4. Does mind reading help or hinder communication?

Answered: 1 week ago