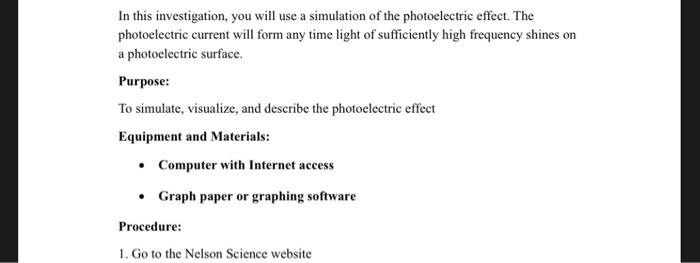
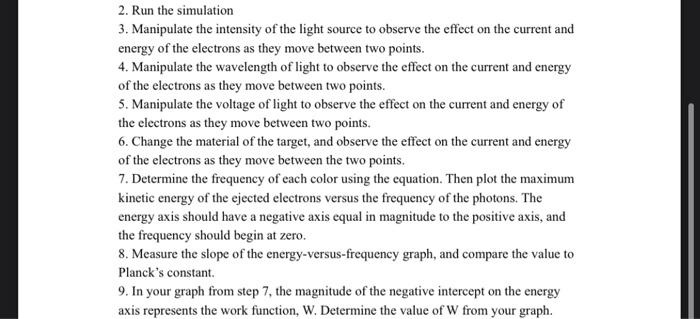
In this investigation, you will use a simulation of the photoelectric effect. The photoelectric current will form any time light of sufficiently high frequency shines on a photoelectric surface. Purpose: To simulate, visualize, and describe the photoelectric effect Equipment and Materials: Computer with Internet access Graph paper or graphing software Procedure: 1. Go to the Nelson Science website 2. Run the simulation 3. Manipulate the intensity of the light source to observe the effect on the current and energy of the electrons as they move between two points. 4. Manipulate the wavelength of light to observe the effect on the current and energy of the electrons as they move between two points. 5. Manipulate the voltage of light to observe the effect on the current and energy of the electrons as they move between two points. 6. Change the material of the target, and observe the effect on the current and energy of the electrons as they move between the two points. 7. Determine the frequency of each color using the equation. Then plot the maximum kinetic energy of the ejected electrons versus the frequency of the photons. The energy axis should have a negative axis equal in magnitude to the positive axis, and the frequency should begin at zero. 8. Measure the slope of the energy-versus-frequency graph, and compare the value to Planck's constant 9. In your graph from step 7, the magnitude of the negative intercept on the energy axis represents the work function, W. Determine the value of W from your graph. In this investigation, you will use a simulation of the photoelectric effect. The photoelectric current will form any time light of sufficiently high frequency shines on a photoelectric surface. Purpose: To simulate, visualize, and describe the photoelectric effect Equipment and Materials: Computer with Internet access Graph paper or graphing software Procedure: 1. Go to the Nelson Science website 2. Run the simulation 3. Manipulate the intensity of the light source to observe the effect on the current and energy of the electrons as they move between two points. 4. Manipulate the wavelength of light to observe the effect on the current and energy of the electrons as they move between two points. 5. Manipulate the voltage of light to observe the effect on the current and energy of the electrons as they move between two points. 6. Change the material of the target, and observe the effect on the current and energy of the electrons as they move between the two points. 7. Determine the frequency of each color using the equation. Then plot the maximum kinetic energy of the ejected electrons versus the frequency of the photons. The energy axis should have a negative axis equal in magnitude to the positive axis, and the frequency should begin at zero. 8. Measure the slope of the energy-versus-frequency graph, and compare the value to Planck's constant 9. In your graph from step 7, the magnitude of the negative intercept on the energy axis represents the work function, W. Determine the value of W from your graph


