

Question: In this lab, we will be exploring ggplot. For all questions, please put appropriate labels and titles. It is good practice to get in
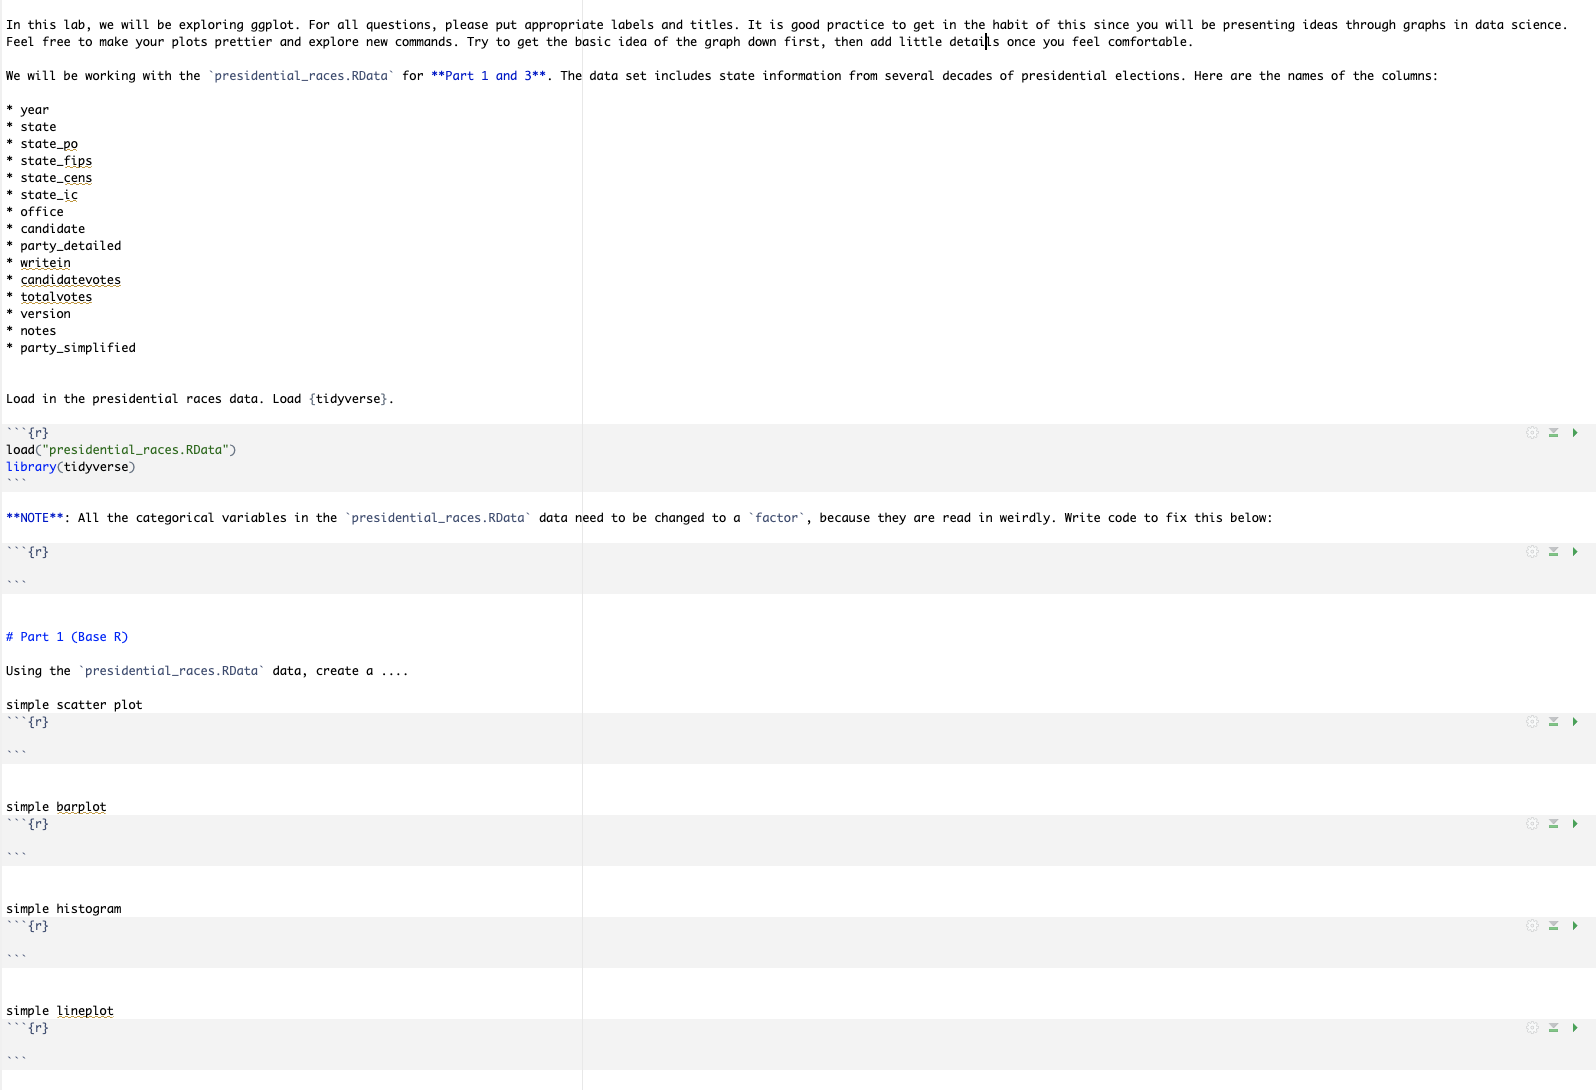
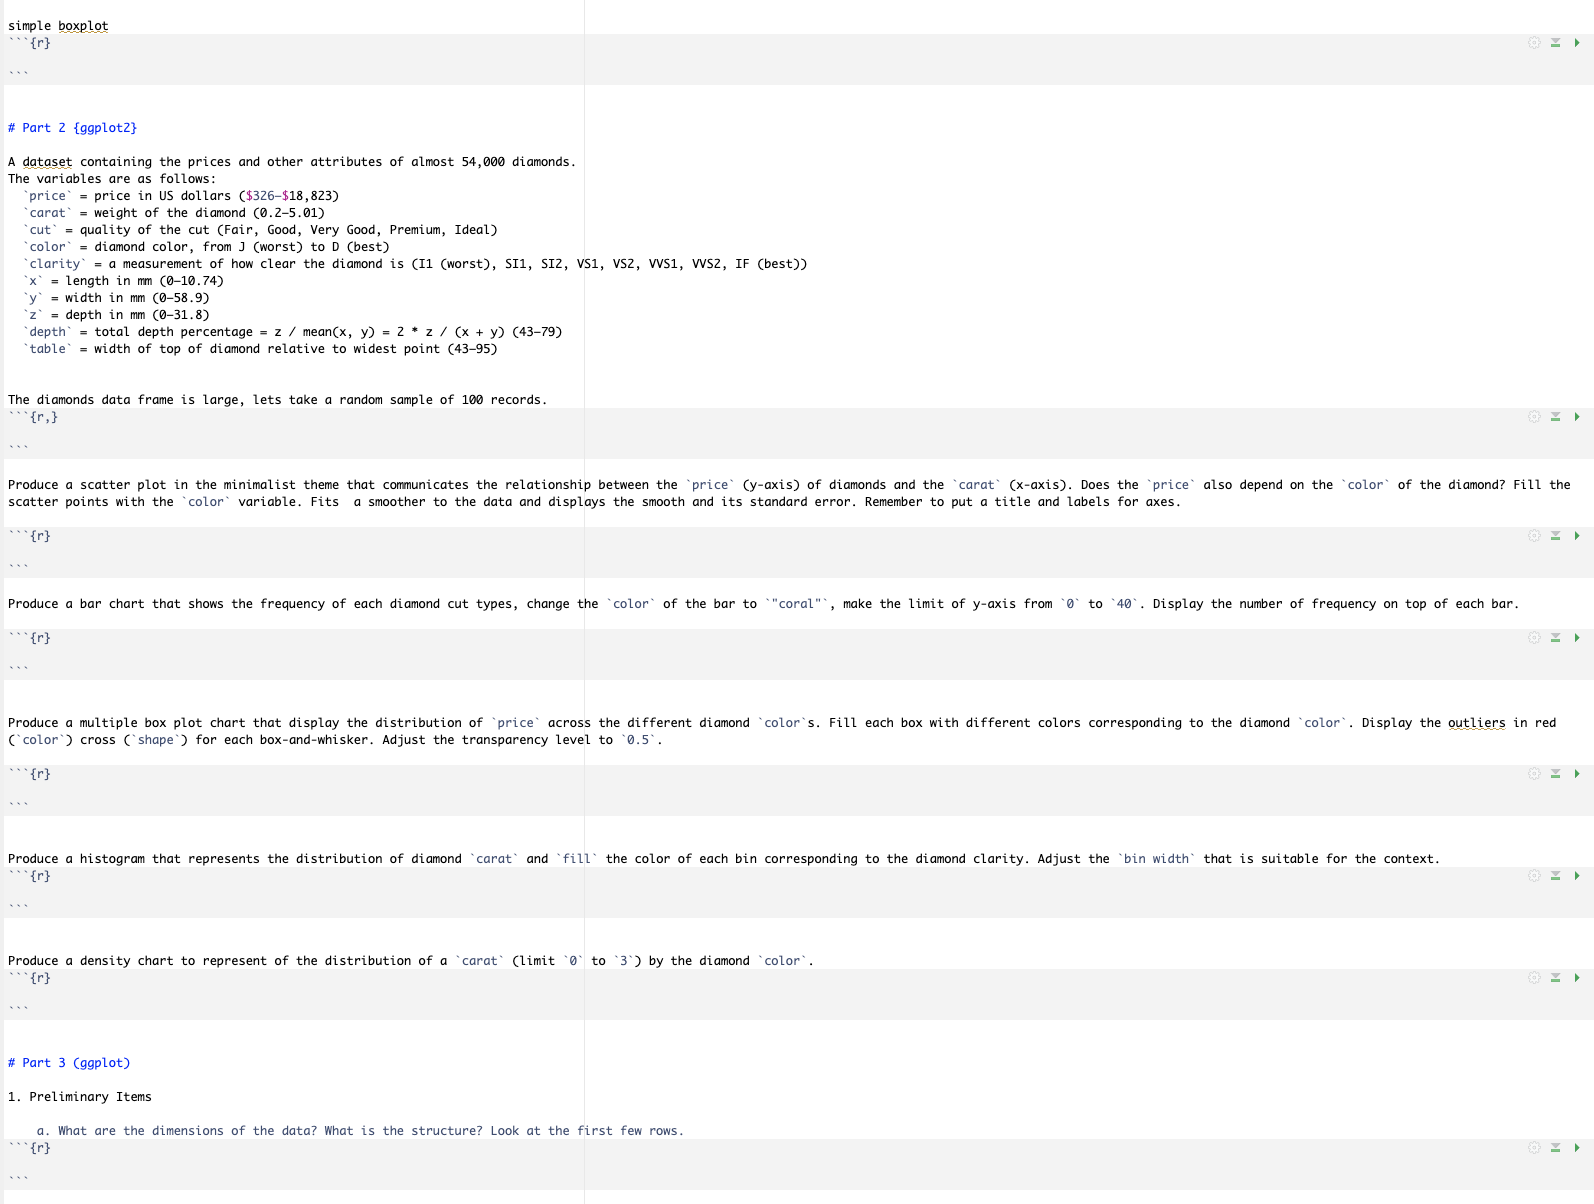
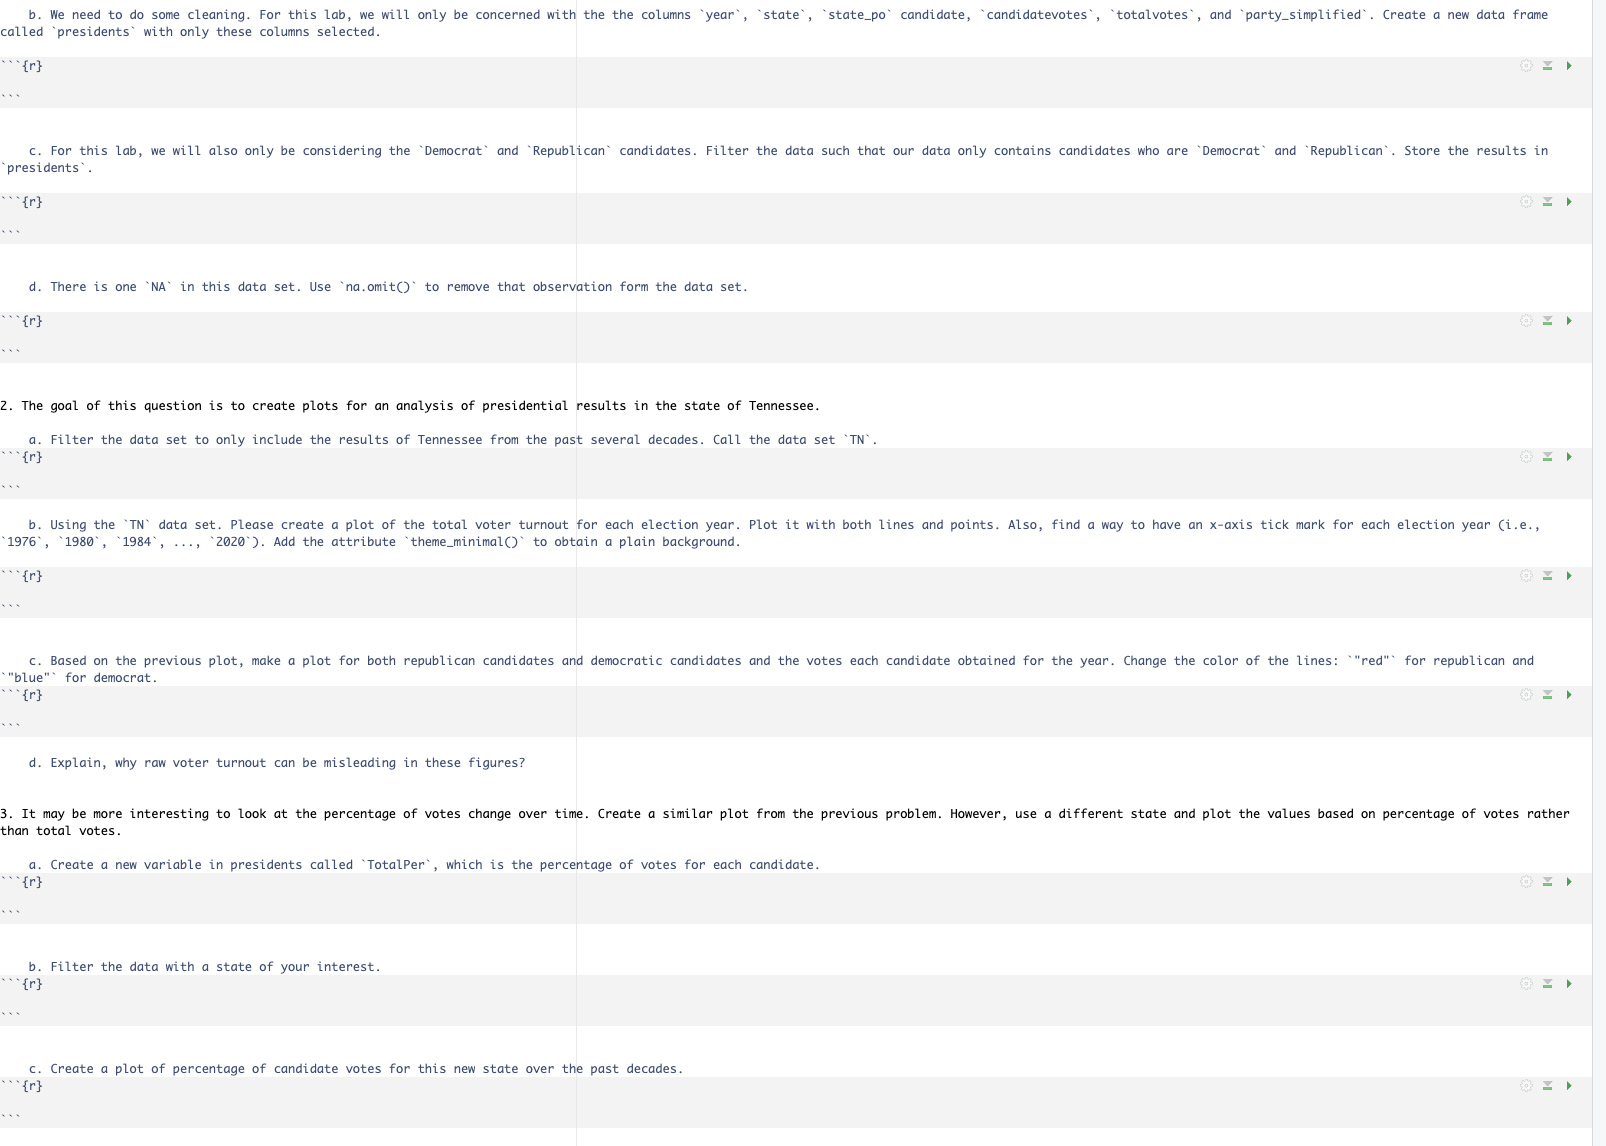
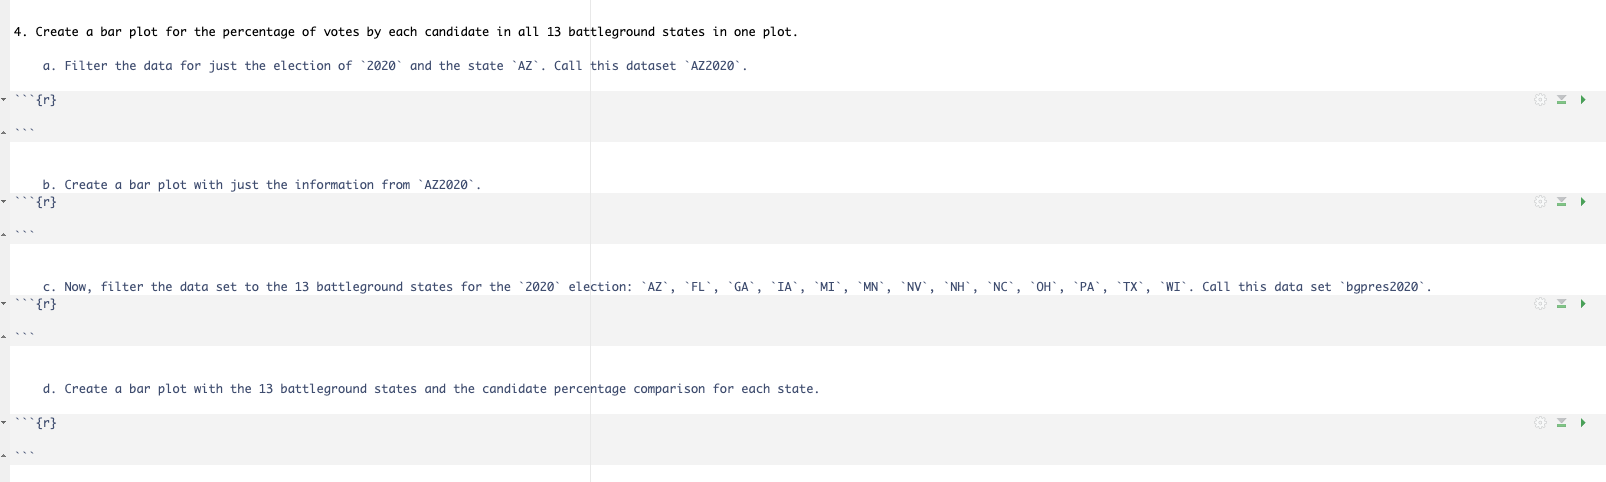
In this lab, we will be exploring ggplot. For all questions, please put appropriate labels and titles. It is good practice to get in the habit of this since you will be presenting ideas through graphs in data science. Feel free to make your plots prettier and explore new commands. Try to get the basic idea of the graph down first, then add little details once you feel comfortable. We will be working with the presidential_races. RData` for **Part 1 and 3**. The data set includes state information from several decades of presidential elections. Here are the names of the columns: * year state * state_po * state_fips *state_cens * state_ic * office candidate party_detailed writein * candidatevotes * totalvotes * version * notes * party_simplified Load in the presidential races data. Load {tidyverse}. {r} **NOTE**: All the categorical variables in the presidential_races. RData` data need to be changed to a `factor`, because they are read in weirdly. Write code to fix this below: {r} load("presidential_races. RData") library(tidyverse) # Part 1 (Base R) Using the presidential_races. RData data, create a .... simple scatter plot ***{r} simple barplot {r} simple histogram {r} simple lineplot {r} simple boxplot `{r} # Part 2 {ggplot2} A dataset containing the prices and other attributes of almost 54,000 diamonds. The variables are as follows: price` = price in US dollars ($326-$18,823) carat` = weight of the diamond (0.2-5.01) cut = quality of the cut (Fair, Good, Very Good, Premium, Ideal) `color` = diamond color, from J (worst) to D (best) `clarity` = a measurement of how clear the diamond is (I1 (worst), SI1, SIZ, VS1, VS2, VVS1, VVS2, IF (best)) `x' = length in mm (0-10.74) `y` = width in mm (0-58.9) z depth in mm (0-31.8) depth = total depth percentage = z / mean(x, y) = 2 * z / (x + y) (43-79) table = width of top of diamond relative to widest point (43-95) The diamonds data frame is large, lets take a random sample of 100 records. {r,} Produce a scatter plot in the minimalist theme that communicates the relationship between the price` (y-axis) of diamonds and the carat (x-axis). Does the price also depend on the color of the diamond? Fill the scatter points with the color variable. Fits a smoother to the data and displays the smooth and its standard error. Remember to put a title and labels for axes. {r} Produce a bar chart that shows the frequency of each diamond cut types, change the color of the bar to "coral", make the limit of y-axis from 0 to 40. Display the number of frequency on top of each bar. {r} Produce a multiple box plot chart that display the distribution of `price across the different diamond color`s. Fill each box with different colors corresponding to the diamond color Display the outliers in red (color) cross (`shape) for each box-and-whisker. Adjust the transparency level to 0.5`. ```{r} Produce a histogram that represents the distribution of diamond `carat and fill the color of each bin corresponding to the diamond clarity. Adjust the bin width` that is suitable for the context. {r} Produce a density chart to represent of the distribution of a carat` (limit 0 to 3) by the diamond `color`. {r} # Part 3 (ggplot) 1. Preliminary Items * Y a. What are the dimensions of the data? What is the structure? Look at the first few rows. {r} b. We need to do some cleaning. For this lab, we will only be concerned with the the columns year`, `state`, `state_po` candidate, candidatevotes`, totalvotes`, and party_simplified. Create a new data frame called 'presidents with only these columns selected. ```{r} c. For this lab, we will also only be considering the Democrat and Republican candidates. Filter the data such that our data only contains candidates who are Democrat and Republican`. Store the results in `presidents`. {r} d. There is one `NA` in this data set. Use `na.omit()` to remove that observation form the data set. ```{r} 2. The goal of this question is to create plots for an analysis of presidential results in the state of Tennessee. a. Filter the data set to only include the results of Tennessee from the past several decades. Call the data set `TN`. --`{r} b. Using the TN data set. Please create a plot of the total voter turnout for each election year. Plot it with both lines and points. Also, find a way to have an x-axis tick mark for each election year (i.e., `1976`, 1980, 1984, 2020). Add the attribute theme_minimal()` to obtain a plain background. c. Based on the previous plot, make a plot for both republican candidates and democratic candidates and the votes each candidate obtained for the year. Change the color of the lines: "red" for republican and "blue" for democrat. {r} d. Explain, why raw voter turnout can be misleading in these figures? 3. It may be more interesting to look at the percentage of votes change over time. Create a similar plot from the previous problem. However, use a different state and plot the values based on percentage of votes rather than total votes. a. Create a new variable in presidents called TotalPer`, which is the percentage of votes for each candidate. {r} b. Filter the data with a state of your interest. {r} c. Create a plot of percentage of candidate votes for this new state over the past decades. ***{r} 4. Create a bar plot for the percentage of votes by each candidate in all 13 battleground states in one plot. a. Filter the data for just the election of 2020 and the state `AZ. Call this dataset AZZOZO`. ```{r} b. Create a bar plot with just the information from `AZZ020 ***{r} c. Now, filter the data set to the 13 battleground states for the 2020 election: AZ`, `FL`, `GA`, `IA`, `MI`, `MN`, `NV`, `NH`, `NC`, `OH`, `PA`, `TX, WI. Call this data set `bgpres2020. ```{r} d. Create a bar plot with the 13 battleground states and the candidate percentage comparison for each state. ```{r} In this lab, we will be exploring ggplot. For all questions, please put appropriate labels and titles. It is good practice to get in the habit of this since you will be presenting ideas through graphs in data science. Feel free to make your plots prettier and explore new commands. Try to get the basic idea of the graph down first, then add little detaills once you feel comfortable. We will be working with the presidential_races. RData` for **Part 1 and 3**. The data set includes state information from several decades of presidential elections. Here are the names of the columns: * year state * state_po * state_fips *state_cens * state_ic * office candidate party_detailed writein * candidatevotes * totalvotes * version * notes * party simplified Load in the presidential races data. Load {tidyverse}. {r} **NOTE**: All the categorical variables in the presidential_races. RData` data need to be changed to a `factor`, because they are read in weirdly. Write code to fix this below: {r} load("presidential_races. RData") library(tidyverse) # Part 1 (Base R) Using the presidential_races. RData data, create a .... simple scatter plot ***{r} simple barplot {r} simple histogram {r} simple lineplot {r} simple boxplot `{r} # Part 2 {ggplot2} A dataset containing the prices and other attributes of almost 54,000 diamonds. The variables are as follows: price` = price in US dollars ($326-$18,823) carat` = weight of the diamond (0.2-5.01) cut =quality of the cut (Fair, Good, Very Good, Premium, Ideal) `color` = diamond color, from J (worst) to D (best) `clarity` = a measurement of how clear the diamond is (I1 (worst), SI1, SIZ, VS1, VS2, VVS1, VVS2, IF (best)) `x' = length in mm (0-10.74) `y` = width in mm (0-58.9) z` = depth in mm (0-31.8) depth = total depth percentage = z / mean(x, y) = 2 * z / (x + y) (43-79) table = width of top of diamond relative to widest point (43-95) The diamonds data frame is large, lets take a random sample of 100 records. {r,} Produce a scatter plot in the minimalist theme that communicates the relationship between the price` (y-axis) of diamonds and the carat (x-axis). Does the price also depend on the color of the diamond? Fill the scatter points with the color variable. Fits a smoother to the data and displays the smooth and its standard error. Remember to put a title and labels for axes. {r} Produce a bar chart that shows the frequency of each diamond cut types, change the color of the bar to "coral", make the limit of y-axis from 0 to 40. Display the number of frequency on top of each bar. {r} Produce a multiple box plot chart that display the distribution of `price across the different diamond color`s. Fill each box with different colors corresponding to the diamond color Display the outliers in red (color) cross (`shape) for each box-and-whisker. Adjust the transparency level to 0.5`. ```{r} Produce a histogram that represents the distribution of diamond `carat and fill the color of each bin corresponding to the diamond clarity. Adjust the `bin width` that is suitable for the context. {r} Produce a density chart to represent of the distribution of a carat` (limit 0 to 3) by the diamond `color`. {r} # Part 3 (ggplot) 1. Preliminary Items * Y a. What are the dimensions of the data? What is the structure? Look at the first few rows. {r} b. We need to do some cleaning. For this lab, we will only be concerned with the the columns year`, `state`, `state_po` candidate, `candidatevotes`, totalvotes`, and party_simplified. Create a new data frame called 'presidents with only these columns selected. ```{r} c. For this lab, we will also only be considering the Democrat and Republican candidates. Filter the data such that our data only contains candidates who are `Democrat and Republican`. Store the results in presidents`. {r} d. There is one `NA` in this data set. Use `na.omit()` to remove that observation form the data set. ```{r} 2. The goal of this question is to create plots for an analysis of presidential results in the state of Tennessee. a. Filter the data set to only include the results of Tennessee from the past several decades. Call the data set `TN`. --`{r} b. Using the `TN data set. Please create a plot of the total voter turnout for each election year. Plot it with both lines and points. Also, find a way to have an x-axis tick mark for each election year (i.e., `1976`, 1980, 1984, 2020). Add the attribute theme_minimal()` to obtain a plain background. c. Based on the previous plot, make a plot for both republican candidates and democratic candidates and the votes each candidate obtained for the year. Change the color of the lines: "red" for republican and "blue" for democrat. {r} d. Explain, why raw voter turnout can be misleading in these figures? 3. It may be more interesting to look at the percentage of votes change over time. Create a similar plot from the previous problem. However, use a different state and plot the values based on percentage of votes rather than total votes. a. Create a new variable in presidents called TotalPer`, which is the percentage of votes for each candidate. {r} b. Filter the data with a state of your interest. {r} c. Create a plot of percentage of candidate votes for this new state over the past decades. ***{r} 4. Create a bar plot for the percentage of votes by each candidate in all 13 battleground states in one plot. a. Filter the data for just the election of 2020 and the state `AZ. Call this dataset AZZOZO`. ```{r} b. Create a bar plot with just the information from `AZZ020 ***{r} c. Now, filter the data set to the 13 battleground states for the 2020 election: AZ`, `FL`, `GA`, `IA`, `MI`, `MN`, `NV`, `NH`, `NC`, `OH`, `PA, TX, WI. Call this data set `bgpres2020. ```{r} d. Create a bar plot with the 13 battleground states and the candidate percentage comparison for each state. ```{r}
Step by Step Solution
There are 3 Steps involved in it
Part 1 Base R Load necessary packages and data loadpresidentialracesRData librarytidyverse Fix categorical variables to factor presidentialraces mutat... View full answer

Get step-by-step solutions from verified subject matter experts