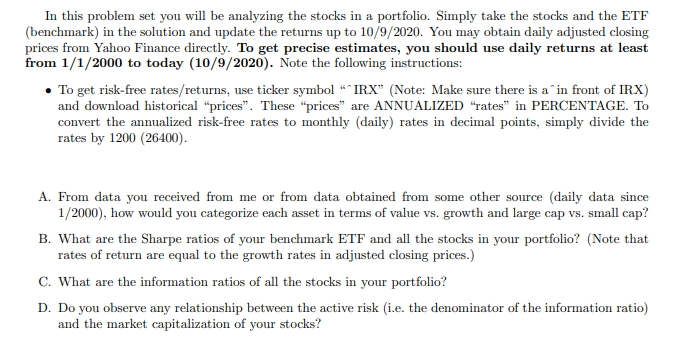
In this problem set you will be analyzing the stocks in a portfolio. Simply take the stocks and the ETF (benchmark) in the solution and update the returns up to 10/9/2020. You may obtain daily adjusted closing prices from Yahoo Finance directly. To get precise estimates, you should use daily returns at least from 1/1/2000 to today (10/9/2020). Note the following instructions: To get risk-free rates/returns, use ticker symbol *IRX (Note: Make sure there is a in front of IRX) and download historical "prices". These "prices" are ANNUALIZED "rates in PERCENTAGE. To convert the annualized risk-free rates to monthly (daily) rates in decimal points, simply divide the rates by 1200 (26400). A. From data you received from me or from data obtained from some other source (daily data since 1/2000), how would you categorize each asset in terms of value vs. growth and large cap vs. small cap? B. What are the Sharpe ratios of your benchmark ETF and all the stocks in your portfolio? (Note that rates of return are equal to the growth rates in adjusted closing prices.) C. What are the information ratios of all the stocks in your portfolio? D. Do you observe any relationship between the active risk (i.e. the denominator of the information ratio) and the market capitalization of your stocks? In this problem set you will be analyzing the stocks in a portfolio. Simply take the stocks and the ETF (benchmark) in the solution and update the returns up to 10/9/2020. You may obtain daily adjusted closing prices from Yahoo Finance directly. To get precise estimates, you should use daily returns at least from 1/1/2000 to today (10/9/2020). Note the following instructions: To get risk-free rates/returns, use ticker symbol *IRX (Note: Make sure there is a in front of IRX) and download historical "prices". These "prices" are ANNUALIZED "rates in PERCENTAGE. To convert the annualized risk-free rates to monthly (daily) rates in decimal points, simply divide the rates by 1200 (26400). A. From data you received from me or from data obtained from some other source (daily data since 1/2000), how would you categorize each asset in terms of value vs. growth and large cap vs. small cap? B. What are the Sharpe ratios of your benchmark ETF and all the stocks in your portfolio? (Note that rates of return are equal to the growth rates in adjusted closing prices.) C. What are the information ratios of all the stocks in your portfolio? D. Do you observe any relationship between the active risk (i.e. the denominator of the information ratio) and the market capitalization of your stocks