Answered step by step
Verified Expert Solution
Question
1 Approved Answer
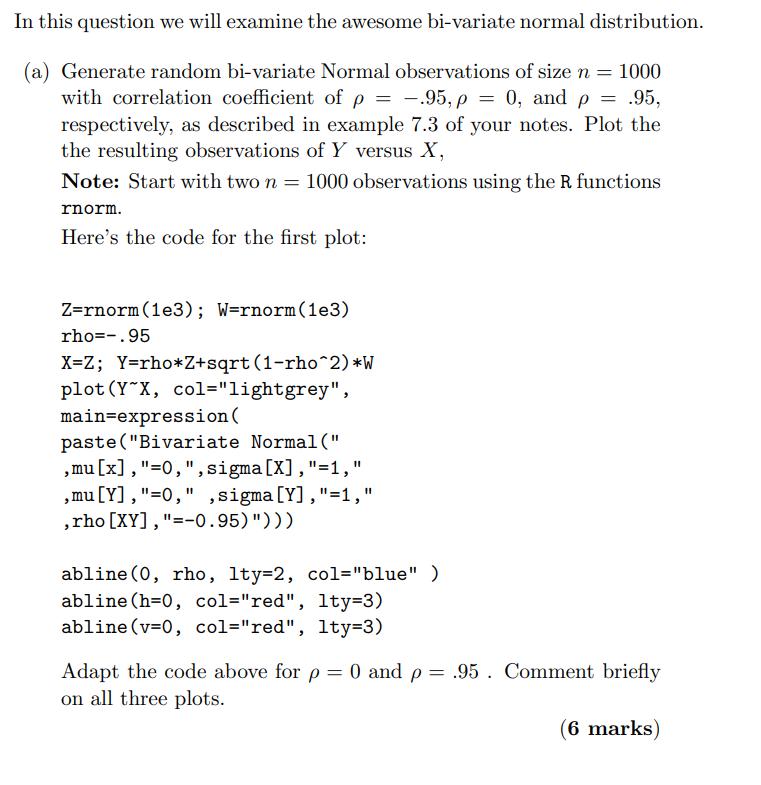
In this question we will examine the awesome bi-variate normal distribution. (a) Generate random bi-variate Normal observations of size n = 1000 with correlation


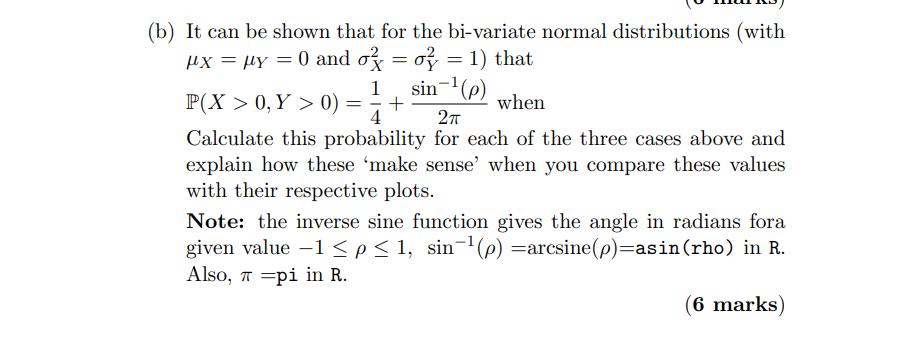
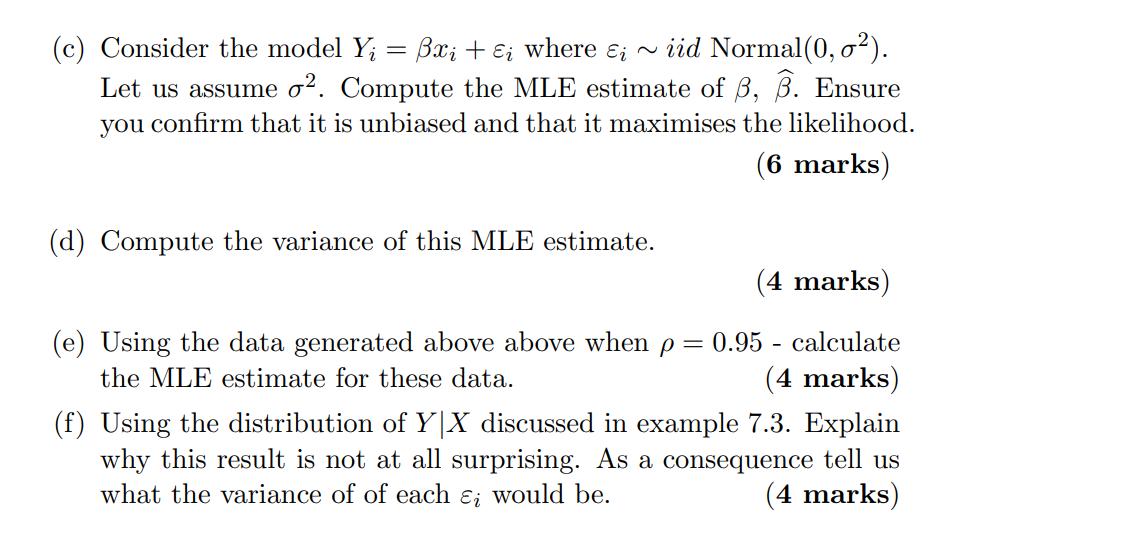
In this question we will examine the awesome bi-variate normal distribution. (a) Generate random bi-variate Normal observations of size n = 1000 with correlation coefficient of p= .95, p = 0, and p = .95, respectively, as described in example 7.3 of your notes. Plot the the resulting observations of Y versus X, Note: Start with two n = 1000 observations using the R functions rnorm. Here's the code for the first plot: Z=rnorm (1e3); W=rnorm (1e3) rho=.95 X=Z; Y=rho*Z+sqrt (1-rho^2) *W plot (Y X, col="lightgrey", main=expression ( paste("Bivariate Normal (" , mu [x], "=0,", sigma [X], "=1," , mu [Y],"=0,", sigma [Y],"=1," , rho [XY], "=-0.95)"))) abline (0, rho, lty-2, col="blue" ) abline (h=0, col="red", 1ty=3) abline(v=0, col="red", lty=3) Adapt the code above for p = 0 and p = .95 . Comment briefly on all three plots. (6 marks) (b) It can be shown that for the bi-variate normal distributions (with x = y = 0 and o=o= 1) that sin- (p) 1 P(X>0, Y > 0) = + when 4 2 Calculate this probability for each of the three cases above and explain how these 'make sense' when you compare these values with their respective plots. Note: the inverse sine function gives the angle in radians fora given value -1 < p 1, sin- (p) = arcsine (p)=asin (rho) in R. Also, =pi in R. (6 marks) (c) Consider the model Y = Bxi + i where Ei ~iid Normal (0, ). Let us assume o. Compute the MLE estimate of 3, 3. Ensure you confirm that it is unbiased and that it maximises the likelihood. (6 marks) (d) Compute the variance of this MLE estimate. (4 marks) = 0.95 calculate (4 marks) (f) Using the distribution of Y|X discussed in example 7.3. Explain why this result is not at all surprising. As a consequence tell us what the variance of of each &; would be. (4 marks) (e) Using the data generated above above when p the MLE estimate for these data. -
Step by Step Solution
There are 3 Steps involved in it
Step: 1

Get Instant Access to Expert-Tailored Solutions
See step-by-step solutions with expert insights and AI powered tools for academic success
Step: 2

Step: 3

Ace Your Homework with AI
Get the answers you need in no time with our AI-driven, step-by-step assistance
Get Started


