Question
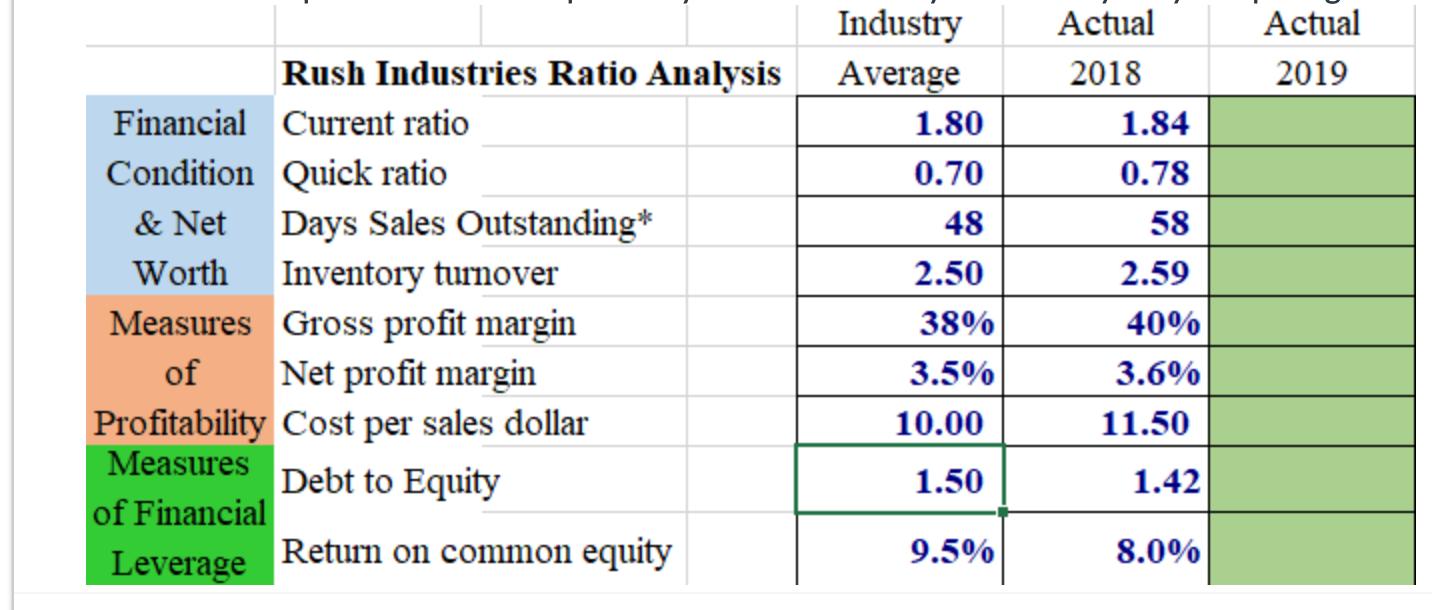
In this question, you will analyze their Measures of Profitability: Although Rush Industries' gross profit margin is ( a . below or b . above
In this question, you will analyze their Measures of Profitability: Although Rush Industries' gross profit margin is a below or b above
its industry average, the company has ana higher or b lower
net profit margin in comparison to average. Additional details are below: Week KPI Assignment
This week you will explore analysis by computing key performance indicators for a company. You should calculate each ratio using the financial statements provided and then choose the correct answer from the choices provided in the assignment. You will round to two decimal places. If it is expressed at a you need to convert to and then take out two decimal places. Standard rounding applies.
Rush Industries Income Statement for the Year Ended December
Sales revenue $
Less: Cost of sales
Gross profits $
Less: Operating expenses
Sales and marketing expense $
General and administrative expenses
Lease expense
Depreciation expense
Total operating expense $
Operating profits $
Less: Interest expense
Net profits before taxes $
Less: Taxes
Net income $
Rush Industries Balance Sheet December
Assets
Cash $
Marketable securities
Accounts receivable
Inventories
Total current assets $
Land $
Buildings and equipment
Less: Accumulated depreciation
Total fixed assets $
Total assets $
Liabilities and Stockholders Equity
Accounts payable $
Notes payable
Total current liabilities $
Longterm debt
Total liabilities
Common stocka
Retained earnings
Total stockholders' equity
Total liabilities and stockholders equity $
a The firms outstanding shares of common stock closed at a price of $ per share.
Using the financial statements above, you will calculate the actual ratios. You will then enter your answers in the questions that follow. The first set of questions will be to provide your ratios. Then you will analyze by comparing to industry and both provided here

Industry Actual Actual Rush Industries Ratio Analysis Average 2018 2019 Financial Current ratio 1.80 1.84 Condition Quick ratio 0.70 0.78 & Net Days Sales Outstanding* 48 58 Worth Inventory turnover 2.50 2.59 Measures Gross profit margin of Net profit margin 38% 40% 3.5% 3.6% Profitability Cost per sales dollar 10.00 11.50 Measures Debt to Equity 1.50 1.42 of Financial Leverage Return on common equity 9.5% 8.0%
Step by Step Solution
3.32 Rating (158 Votes )
There are 3 Steps involved in it
Step: 1
Based on the provided information the measures of profitability for Rush Industries are as follows G...
Get Instant Access to Expert-Tailored Solutions
See step-by-step solutions with expert insights and AI powered tools for academic success
Step: 2

Step: 3

Ace Your Homework with AI
Get the answers you need in no time with our AI-driven, step-by-step assistance
Get Started


