Answered step by step
Verified Expert Solution
Link Copied!

Question

1 Approved Answer

In this Regional Sample, the response variable (y) is the median listing price and the predictor variable (x) is the median square feet. This graph

In this Regional Sample, the response variable (y) is the median listing price and the predictor variable (x) is the median square feet. This graph shows us that as the listing price of the house increases as the square footage of the house is increased. There is a mostly even split of homes above the line and below the line as well a few that fall on the line. Overall the represents a trend that can predict the listing prices of homes based off of square footage pretty accurately.

No outliers were recognized in the data. Outliers that could skew the data can come from counties with a generally higher living expense and higher end living. This means that the square footage is essence has more value so it would cost more which would be taken into consideration when pricing in those counties.

Using the equation y = 89.537x+65538.235 if you were to have 1800 square feet home

the predicted listing price for this home would be around $226,705. This prediction can be proven by plugging 1800 in the place of x in our equation. This is what that would look like 89.537(1800)+65538.235=226,704.835.
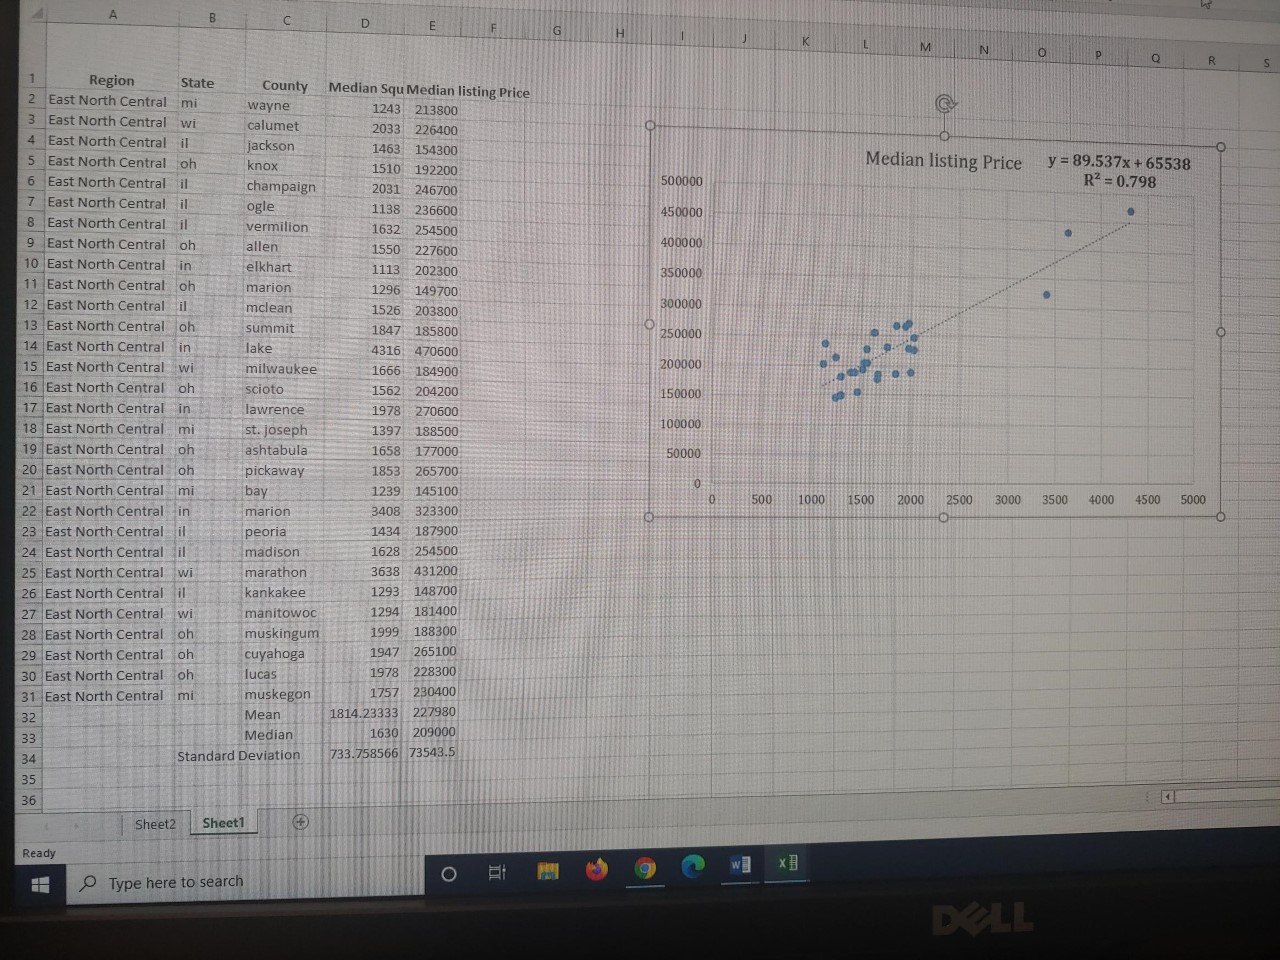
image text in transcribed
B E G H M IN Q R Region State County Median Squ Median listing Price N East North Central mi wayne 1243 213800 3 East North Central wi calumet 2033 226400 East North Central il jackson 1463 154300 5 East North Central oh knox Median listing Price y =89.537x +65538 1510 192200 6 East North Central il 500000 R- = 0.798 champaign 2031 246700 7 East North Central il ogle 1138 236600 450000 8 East North Central il vermilion 1632 254500 9 East North Central oh allen 400000 1550 227600 10 East North Central in elkhart 1113 202300 350000 11 East North Central oh marion 1296 149700 12 East North Central il mclean 1526 203800 300000 13 East North Central oh summit 1847 185800 250000 14 East North Central in lake 4316 470600 15 East North Central wi milwaukee 1666 184900 200000 16 East North Central oh scioto 1562 204200 150000 17 East North Central in lawrence 1978 270600 18 East North Central mi st. joseph 1397 188500 1000 00 19 East North Central oh ashtabula 1658 177000 50000 20 East North Central oh pickaway 1853 265700 21 East North Central mi bay 1239 145100 500 1000 1500 2000 2500 3000 3500 4000 4500 5000 22 East North Central in marion 3408 323300 23 East North Central il peoria 1434 187900 24 East North Central il madison 1628 254500 25 East North Central wi marathon 3638 431200 26 East North Central il kankakee 1293 148700 27 East North Central wi manitowoc 1294 181400 28 East North Central oh muskingum 1999 188300 29 East North Central oh cuyahoga 1947 265100 30 East North Central oh lucas 1978 228300 31 East North Central mi muskegon 1757 230400 32 Mean 1814.23333 227980 33 Median 1630 209000 34 Standard Deviation 733.758566 73543.5 35 36 Sheet2 Sheet1 Ready O 9 x ] Type here to search DELL

Step by Step Solution

There are 3 Steps involved in it

Step: 1

blur-text-image

Get Instant Access to Expert-Tailored Solutions

See step-by-step solutions with expert insights and AI powered tools for academic success

Step: 2

blur-text-image

Step: 3

blur-text-image

Ace Your Homework with AI

Get the answers you need in no time with our AI-driven, step-by-step assistance

Get Started

Recommended Textbook for

Advanced Engineering Mathematics

Authors: ERWIN KREYSZIG

9th Edition

0471488852, 978-0471488859

More Books

Students also viewed these Mathematics questions