

Question: Include correctly labeled diagrams, if useful or required, in explaining your answers. A correctly labeled diagram must have all axes and curves clearly labeled and
Include correctly labeled diagrams, if useful or required, in explaining your answers. A correctly labeled diagram must have all axes and curves clearly labeled and must show directional changes. If the question prompts you to "Calculate", you must show how you arrived at your final answer.\ The data provided below describe an ice-cream store's daily production possibilities for milkshakes and sundaes.\ \\\\table[[Milkshakes,0,20,40,60,80,100,120],[Sundaes,210,200,180,150,110,60,0]]\ (a) Draw a correctly labeled graph of the store's production possibilities curve (PPC) with milkshakes on the horizontal axis and sundaes on the vertical axis and label the endpoints using the numbers provided above.\ (b) Is the opportunity cost of producing milkshakes increasing, decreasing, or constant? Explain using numbers in the table.\ (c) The store is currently producing 80 milkshakes and 110 sundaes. Calculate the opportunity cost of increasing milkshake production from 80 to 100 milkshakes. Show your work.\ (d) Would it be efficient for the store to produce 80 milkshakes and 150 sundaes? Explain using numbers in the table.\ (e) Suppose the ice-cream store purchases a new machine that increases the output of milkshakes and sundaes. Show the effect of the change on the store's PPC on your graph in part (a).
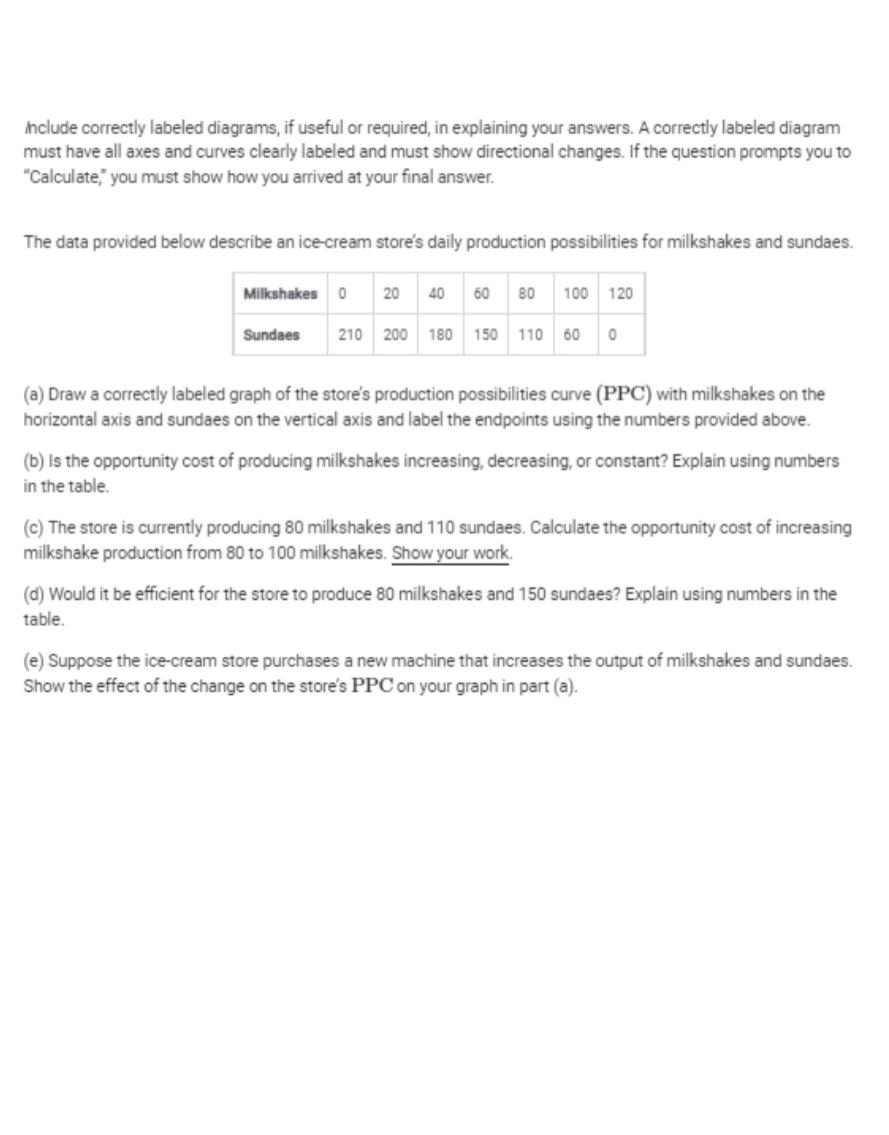
Include correctly labeled diagrams, if useful or required, in explaining your answers. A correctly labeled diagram must have all axes and curves clearly labeled and must show directional changes. If the question prompts you to "Calculate," you must show how you arrived at your final answer. The data provided below describe an ice-cream store's daily production possibilities for milkshakes and sundaes. (a) Draw a correctly labeled graph of the store's production possibilities curve (PPC) with milkshakes on the horizontal axis and sundaes on the vertical axis and label the endpoints using the numbers provided above. (b) Is the opportunity cost of producing milkshakes increasing, decreasing, or constant? Explain using numbers in the table. (c) The store is currently producing 80 milkshakes and 110 sundaes. Calculate the opportunity cost of increasing milkshake production from 80 to 100 milkshakes. Show your work. (d) Would it be efficient for the store to produce 80 milkshakes and 150 sundaes? Explain using numbers in the table. (e) Suppose the ice-cream store purchases a new machine that increases the output of milkshakes and sundaes. Show the effect of the change on the store's PPC on your graph in part (a). Include correctly labeled diagrams, if useful or required, in explaining your answers. A correctly labeled diagram must have all axes and curves clearly labeled and must show directional changes. If the question prompts you to "Calculate," you must show how you arrived at your final answer. The data provided below describe an ice-cream store's daily production possibilities for milkshakes and sundaes. (a) Draw a correctly labeled graph of the store's production possibilities curve (PPC) with milkshakes on the horizontal axis and sundaes on the vertical axis and label the endpoints using the numbers provided above. (b) Is the opportunity cost of producing milkshakes increasing, decreasing, or constant? Explain using numbers in the table. (c) The store is currently producing 80 milkshakes and 110 sundaes. Calculate the opportunity cost of increasing milkshake production from 80 to 100 milkshakes. Show your work. (d) Would it be efficient for the store to produce 80 milkshakes and 150 sundaes? Explain using numbers in the table. (e) Suppose the ice-cream store purchases a new machine that increases the output of milkshakes and sundaes. Show the effect of the change on the store's PPC on your graph in part (a)
Step by Step Solution
There are 3 Steps involved in it

Get step-by-step solutions from verified subject matter experts