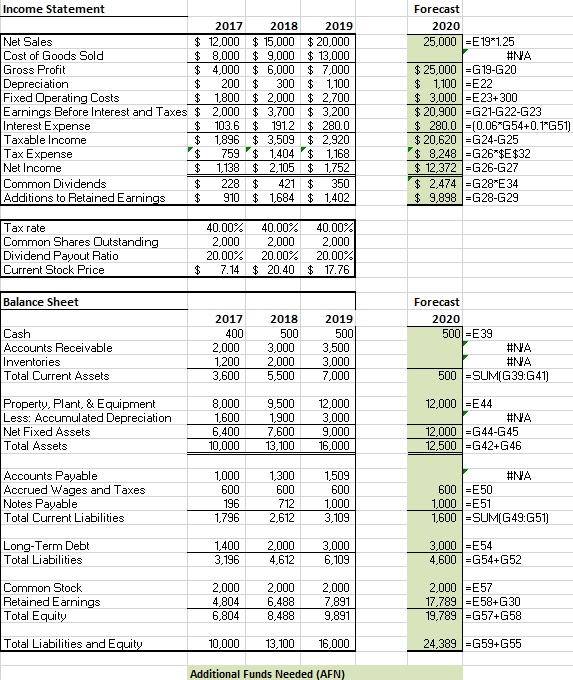
Income Statement 2017 Net Sales $ 12,000 Cost of Goods Sold $ 8,000 Gross Profit $ 4,000 Depreciation $ 200 Fixed Operating Costs $ 1,800 Earnings Before Interest and Taxes $ 2,000 Interest Expense $ 103.6 Taxable income $ 1,896 Tax Expense $ 759 Net Income $ 1,138 Common Dividends $ 228 Additions to Retained Earnings $ 910 2018 2019 $ 15,000 $20,000 $ 9,000 $ 13,000 $ 6,000 $ 7,000 $ 300 $ 1,100 $ 2,000 $ 2,700 $ 3,700 $ 3,200 $ 191.2 $ 280.0 $ 3,509 $ 2,920 $ 1,404 $ 1,168 $ 2,105 $ 1,752 $ 421 $ 350 $ 1,684 $ 1,402 Forecast 2020 25,000 =E191.25 #NA $ 25,000 EG 19-G20 $ 1,100 =E22 $ 3,000 =E23+300 $ 20,900 =G21-G22-G23 $ 280.0 =(0.06 G54+0.1-G51) $ 20,620 =G24-G25 $ 8,248 =G26 $E$32 $ 12,372 =G26-G27 $ 2,474 =G28 E34 $ 9,898 =G28-G29 Tax rate Common Shares Outstanding Dividend Payout Ratio Current Stock Price 40.00% 2,000 20.00% 7.14 40.00% 2,000 20.00% $ 20.40 40.00% 2,000 20.00% $ 17.76 $ Balance Sheet Cash Accounts Receivable Inventories Total Current Assets 2017 400 2,000 1,200 3,600 2018 500 3,000 2,000 5,500 2019 500 3,500 3,000 7,000 Forecast 2020 500 =E39 #NA #NA 500 =SUM(G39:G41) Property, Plant, & Equipment Less: Accumulated Depreciation Net Fixed Assets Total Assets 8,000 1,600 6,400 10,000 9,500 1,900 7,600 13,100 12,000 3,000 9,000 16,000 12,000 =E44 #NA 12,000 =G44-G45 12,500 =G42+G46 Accounts Payable Accrued Wages and Taxes Notes Payable Total Current Liabilities 1,000 600 196 1,796 1,300 600 712 2.612 1,509 600 1,000 3,109 #NA 600 =E50 1,000 =E51 1,600 =SUM(G49:G51) Long-Term Debt Total Liabilities 1,400 3,196 2,000 4,612 3.000 6,109 3.000 EE54 4,600 =G54+G52 2,000 Common Stock Retained Earnings Total Equity 2,000 4,804 6,804 2,000 7,891 9,891 2,000 =E57 17,789 =E58+G30 19,789 =G57+G58 8,488 Total Liabilities and Equity 10,000 13,100 16,000 24,389 =G59+G55 Additional Funds Needed (AFN) Income Statement 2017 Net Sales $ 12,000 Cost of Goods Sold $ 8,000 Gross Profit $ 4,000 Depreciation $ 200 Fixed Operating Costs $ 1,800 Earnings Before Interest and Taxes $ 2,000 Interest Expense $ 103.6 Taxable income $ 1,896 Tax Expense $ 759 Net Income $ 1,138 Common Dividends $ 228 Additions to Retained Earnings $ 910 2018 2019 $ 15,000 $20,000 $ 9,000 $ 13,000 $ 6,000 $ 7,000 $ 300 $ 1,100 $ 2,000 $ 2,700 $ 3,700 $ 3,200 $ 191.2 $ 280.0 $ 3,509 $ 2,920 $ 1,404 $ 1,168 $ 2,105 $ 1,752 $ 421 $ 350 $ 1,684 $ 1,402 Forecast 2020 25,000 =E191.25 #NA $ 25,000 EG 19-G20 $ 1,100 =E22 $ 3,000 =E23+300 $ 20,900 =G21-G22-G23 $ 280.0 =(0.06 G54+0.1-G51) $ 20,620 =G24-G25 $ 8,248 =G26 $E$32 $ 12,372 =G26-G27 $ 2,474 =G28 E34 $ 9,898 =G28-G29 Tax rate Common Shares Outstanding Dividend Payout Ratio Current Stock Price 40.00% 2,000 20.00% 7.14 40.00% 2,000 20.00% $ 20.40 40.00% 2,000 20.00% $ 17.76 $ Balance Sheet Cash Accounts Receivable Inventories Total Current Assets 2017 400 2,000 1,200 3,600 2018 500 3,000 2,000 5,500 2019 500 3,500 3,000 7,000 Forecast 2020 500 =E39 #NA #NA 500 =SUM(G39:G41) Property, Plant, & Equipment Less: Accumulated Depreciation Net Fixed Assets Total Assets 8,000 1,600 6,400 10,000 9,500 1,900 7,600 13,100 12,000 3,000 9,000 16,000 12,000 =E44 #NA 12,000 =G44-G45 12,500 =G42+G46 Accounts Payable Accrued Wages and Taxes Notes Payable Total Current Liabilities 1,000 600 196 1,796 1,300 600 712 2.612 1,509 600 1,000 3,109 #NA 600 =E50 1,000 =E51 1,600 =SUM(G49:G51) Long-Term Debt Total Liabilities 1,400 3,196 2,000 4,612 3.000 6,109 3.000 EE54 4,600 =G54+G52 2,000 Common Stock Retained Earnings Total Equity 2,000 4,804 6,804 2,000 7,891 9,891 2,000 =E57 17,789 =E58+G30 19,789 =G57+G58 8,488 Total Liabilities and Equity 10,000 13,100 16,000 24,389 =G59+G55 Additional Funds Needed (AFN)