

Question
Income Statement: Balance Sheet: Develop common-size financial statements and other financial ratios, including liquidity, leverage and profitability ratios for each year. What do you observe?
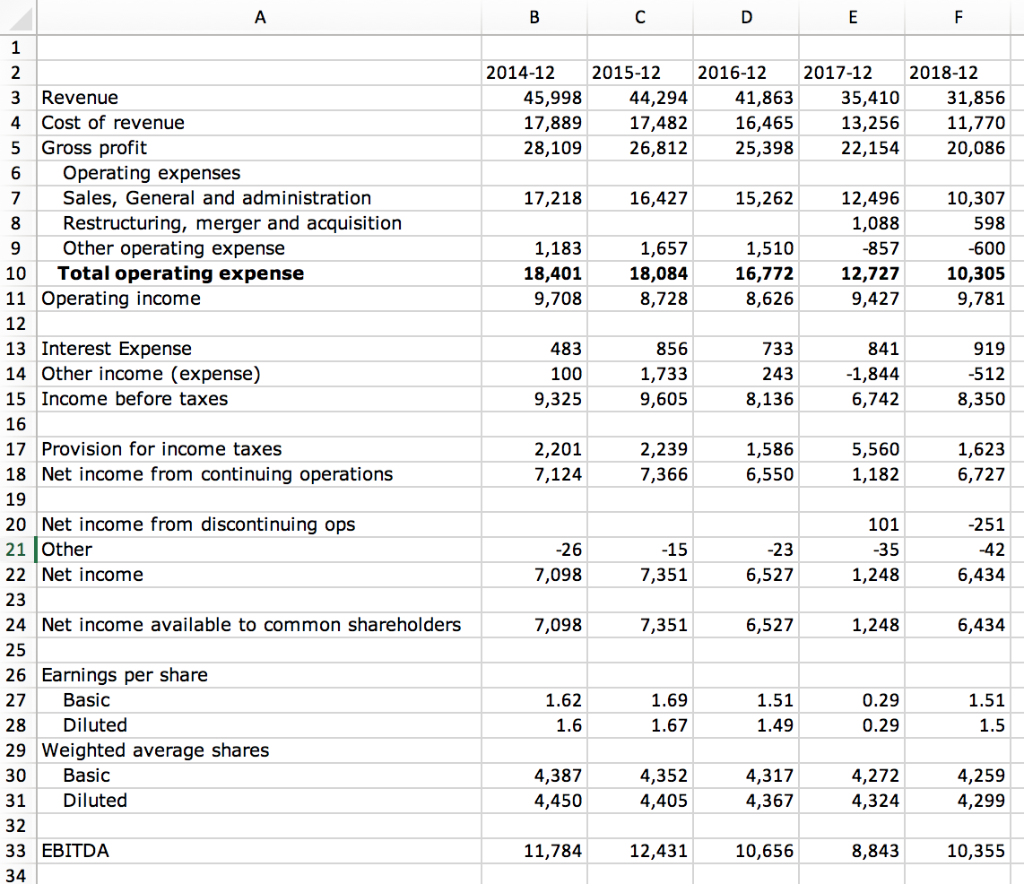
Income Statement:
 Balance Sheet:
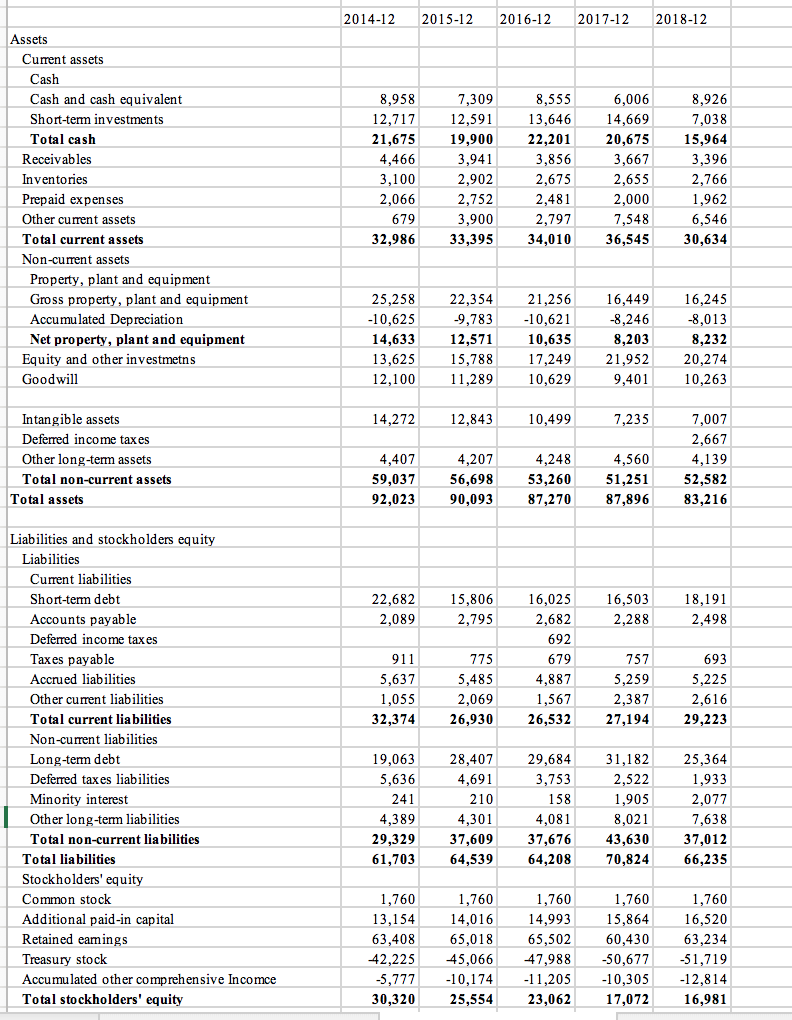
Develop common-size financial statements and other financial ratios, including liquidity, leverage and profitability ratios for each year. What do you observe?
Develop pro forma income statements for 2019-2023 using historical financial statements. Be sure to consider changes in financial statement accounts and trends in your analysis. Explain all of your assumptions.
1 2 3 Revenue 4 Cost of revenue 5 Gross profit 6 Operating expenses 7 Sales, General and administration 8 Restructuring, merger and acquisition 9 Other operating expense 10 Total operating expense 11 Operating income 2014-12 2015-12 2016-12 2017-12 2018-12 31,856 11,770 20,086 45,998 17,889 28,109 44,294 17,482 26,812 41,863 16,465 25,398 35,410 13,256 22,154 17,218 16,427 15,262 12,496 1,088 10,307 598 -600 10,305 9,781 1,183 18,401 9,708 1,657 18,084 8,728 1,510 16,772 8,626 12,727 9,427 483 100 9,325 13Interest Expense 14 Other income (expense) 15 Income before taxes 856 1,733 9,605 733 -1,844 6,742 8,350 17 Provision for income taxes 18 Net income from continuing operations 1,586 6,550 2,201 7,124 2,239 7,366 5,560 1,182 1,623 6,727 20 Net income from discontinuing ops 21 |Other 22 Net income 6,434 7,098 6,527 1,248 7,351 24 Net income available to common shareholders 7,098 7,351 6,527 1,248 6,434 26 Earnings per share 27 Basic 28 Diluted 29 Weighted average shares 4,259 4,299 4,352 4,405 4,317 4,272 4,387 31 Diluted 11,784 33 EBITDA 12,431 10,656 10,355 2014-12 2015-12 2016-12 2017-12 2018-12 Assets Current assets as Cash and cash equivalent 6,006 13,64614,669 20,675 3,667 8,926 15,964 2,766 Short-tem investments 12,71712,591 19,900 2,902 3,900 22,201 Total cash Receivables Inventories Prepaid expenses Other current assets Total current assets Non-current assets 21,675 4,466 2,066 2,000 2,797 32,98633,39534,01036,545 30,634 Property, plant and equipment Gross property, plant and equipment Accumu lated Depreciation Net property, plant and equipment 25,25822,35421,25616,449 16,245 10,6259,78310,621-8,246-8,013 8,232 13,625 15,78817,249 21,952 20,274 12,100 1,28910,629 9,401 10,263 14,63312,57110,635 8,203 Equity and other investmetns Goodwill 7,007 2,667 Intangible assets Deferred income taxes Other long-term assets Total non-current assets 10,499 4,560 4,407 59,03756,69853,260 51,25152,582 92,02390,09387,270 87,89683,216 Total assets Liabilities and stockholders equity Liabilities Current liabilities Short-tem debt Accounts payable Deferred income taxes Taxes payable Accrued liabilities 22,682 15,80616,025 16,503 2,498 692 her current liabilities Total current liabilities Non-current liabilities Long-term debt Deferred taxes liabilities Minority interest Other long-term liabilities Total non-current liabilities 2,069 32,37426,93026,53227,19429,223 19,063 28,40729,68431,18225,364 1,905 7,638 29,32937,60937,676 43,63037,012 66,235 61,703 Total liabilities Stockholders' equity Common stock Additional paid-in capital Retained eamings Treasury stock Accumulated other comprehensive Incomce Total stockholders' equity 70,824 64,539 64,208 1,760 16,520 63,408 65,01865,502 60,430 63,234 42,22545,06647,988-50,677-51,719 5,777 -10,17411,20510,305-12,814 30,32025,55423,06217,072 16,981 1,760 13,154 1,760 14,01614,993 1,760 1,760 1 2 3 Revenue 4 Cost of revenue 5 Gross profit 6 Operating expenses 7 Sales, General and administration 8 Restructuring, merger and acquisition 9 Other operating expense 10 Total operating expense 11 Operating income 2014-12 2015-12 2016-12 2017-12 2018-12 31,856 11,770 20,086 45,998 17,889 28,109 44,294 17,482 26,812 41,863 16,465 25,398 35,410 13,256 22,154 17,218 16,427 15,262 12,496 1,088 10,307 598 -600 10,305 9,781 1,183 18,401 9,708 1,657 18,084 8,728 1,510 16,772 8,626 12,727 9,427 483 100 9,325 13Interest Expense 14 Other income (expense) 15 Income before taxes 856 1,733 9,605 733 -1,844 6,742 8,350 17 Provision for income taxes 18 Net income from continuing operations 1,586 6,550 2,201 7,124 2,239 7,366 5,560 1,182 1,623 6,727 20 Net income from discontinuing ops 21 |Other 22 Net income 6,434 7,098 6,527 1,248 7,351 24 Net income available to common shareholders 7,098 7,351 6,527 1,248 6,434 26 Earnings per share 27 Basic 28 Diluted 29 Weighted average shares 4,259 4,299 4,352 4,405 4,317 4,272 4,387 31 Diluted 11,784 33 EBITDA 12,431 10,656 10,355 2014-12 2015-12 2016-12 2017-12 2018-12 Assets Current assets as Cash and cash equivalent 6,006 13,64614,669 20,675 3,667 8,926 15,964 2,766 Short-tem investments 12,71712,591 19,900 2,902 3,900 22,201 Total cash Receivables Inventories Prepaid expenses Other current assets Total current assets Non-current assets 21,675 4,466 2,066 2,000 2,797 32,98633,39534,01036,545 30,634 Property, plant and equipment Gross property, plant and equipment Accumu lated Depreciation Net property, plant and equipment 25,25822,35421,25616,449 16,245 10,6259,78310,621-8,246-8,013 8,232 13,625 15,78817,249 21,952 20,274 12,100 1,28910,629 9,401 10,263 14,63312,57110,635 8,203 Equity and other investmetns Goodwill 7,007 2,667 Intangible assets Deferred income taxes Other long-term assets Total non-current assets 10,499 4,560 4,407 59,03756,69853,260 51,25152,582 92,02390,09387,270 87,89683,216 Total assets Liabilities and stockholders equity Liabilities Current liabilities Short-tem debt Accounts payable Deferred income taxes Taxes payable Accrued liabilities 22,682 15,80616,025 16,503 2,498 692 her current liabilities Total current liabilities Non-current liabilities Long-term debt Deferred taxes liabilities Minority interest Other long-term liabilities Total non-current liabilities 2,069 32,37426,93026,53227,19429,223 19,063 28,40729,68431,18225,364 1,905 7,638 29,32937,60937,676 43,63037,012 66,235 61,703 Total liabilities Stockholders' equity Common stock Additional paid-in capital Retained eamings Treasury stock Accumulated other comprehensive Incomce Total stockholders' equity 70,824 64,539 64,208 1,760 16,520 63,408 65,01865,502 60,430 63,234 42,22545,06647,988-50,677-51,719 5,777 -10,17411,20510,305-12,814 30,32025,55423,06217,072 16,981 1,760 13,154 1,760 14,01614,993 1,760 1,760Step by Step Solution
There are 3 Steps involved in it
Step: 1

Get Instant Access to Expert-Tailored Solutions
See step-by-step solutions with expert insights and AI powered tools for academic success
Step: 2

Step: 3
Ace Your Homework with AI
Get the answers you need in no time with our AI-driven, step-by-step assistance
Get Started
Managerial Accounting A Focus On Ethical Decision Making
Authors: Jackson
5th Edition
B00651UGQG