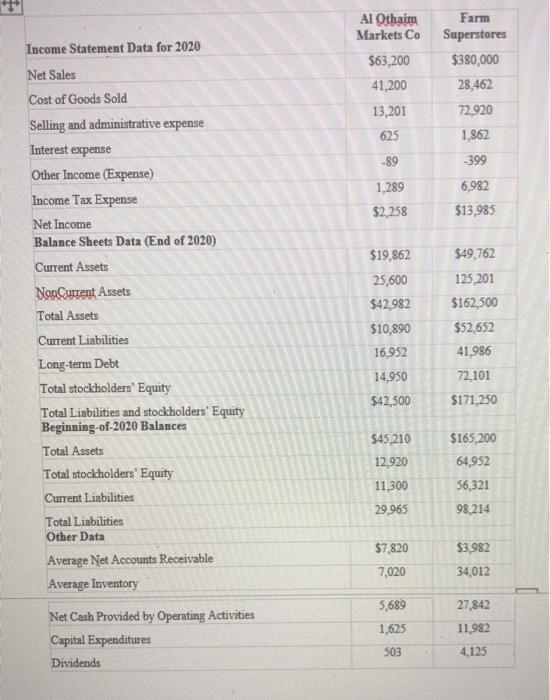
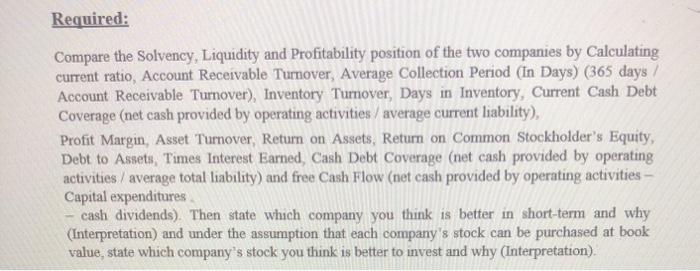
Income Statement Data for 2020 Al Othaim Markets Co $63,200 41,200 13,201 Farm Superstores $380,000 28,462 72,920 625 1,862 -399 -89 1,289 6,982 $13,985 $2,258 $19,862 25,600 $42,982 $10,890 16,952 Net Sales Cost of Goods Sold Selling and administrative expense Interest expense Other Income (Expense) Income Tax Expense Net Income Balance Sheets Data (End of 2020) Current Assets Non Current Assets Total Assets Current Liabilities Long-term Debt Total stockholders' Equity Total Liabilities and stockholders' Equity Beginning-of-2020 Balances Total Assets Total stockholders' Equity Current Liabilities Total Liabilities Other Data Average Net Accounts Receivable Average Inventory Net Cash Provided by Operating Activities Capital Expenditures Dividends $49,762 125,201 $162,500 $52,652 41,986 72,101 $171,250 14,950 $42,500 $45,210 12,920 $165,200 64,952 56,321 98,214 11,300 29.965 $7,820 $3,982 34,012 7,020 27,842 5,689 1.625 11,982 4.125 503 Required: Compare the Solvency, Liquidity and Profitability position of the two companies by Calculating current ratio, Account Receivable Tumover, Average Collection Period (In Days) (365 days / Account Receivable Turnover), Inventory Turnover, Days in Inventory, Current Cash Debt Coverage (net cash provided by operating activities / average current liability), Profit Margin, Asset Turnover, Return on Assets, Return on Common Stockholder's Equity, Debt to Assets, Times Interest Earned, Cash Debt Coverage (net cash provided by operating activities / average total liability) and free Cash Flow (net cash provided by operating activities - Capital expenditures cash dividends). Then state which company you think is better in short-term and why (Interpretation) and under the assumption that each company's stock can be purchased at book value, state which company's stock you think is better to invest and why (Interpretation) Income Statement Data for 2020 Al Othaim Markets Co $63,200 41,200 13,201 Farm Superstores $380,000 28,462 72,920 625 1,862 -399 -89 1,289 6,982 $13,985 $2,258 $19,862 25,600 $42,982 $10,890 16,952 Net Sales Cost of Goods Sold Selling and administrative expense Interest expense Other Income (Expense) Income Tax Expense Net Income Balance Sheets Data (End of 2020) Current Assets Non Current Assets Total Assets Current Liabilities Long-term Debt Total stockholders' Equity Total Liabilities and stockholders' Equity Beginning-of-2020 Balances Total Assets Total stockholders' Equity Current Liabilities Total Liabilities Other Data Average Net Accounts Receivable Average Inventory Net Cash Provided by Operating Activities Capital Expenditures Dividends $49,762 125,201 $162,500 $52,652 41,986 72,101 $171,250 14,950 $42,500 $45,210 12,920 $165,200 64,952 56,321 98,214 11,300 29.965 $7,820 $3,982 34,012 7,020 27,842 5,689 1.625 11,982 4.125 503 Required: Compare the Solvency, Liquidity and Profitability position of the two companies by Calculating current ratio, Account Receivable Tumover, Average Collection Period (In Days) (365 days / Account Receivable Turnover), Inventory Turnover, Days in Inventory, Current Cash Debt Coverage (net cash provided by operating activities / average current liability), Profit Margin, Asset Turnover, Return on Assets, Return on Common Stockholder's Equity, Debt to Assets, Times Interest Earned, Cash Debt Coverage (net cash provided by operating activities / average total liability) and free Cash Flow (net cash provided by operating activities - Capital expenditures cash dividends). Then state which company you think is better in short-term and why (Interpretation) and under the assumption that each company's stock can be purchased at book value, state which company's stock you think is better to invest and why (Interpretation)


