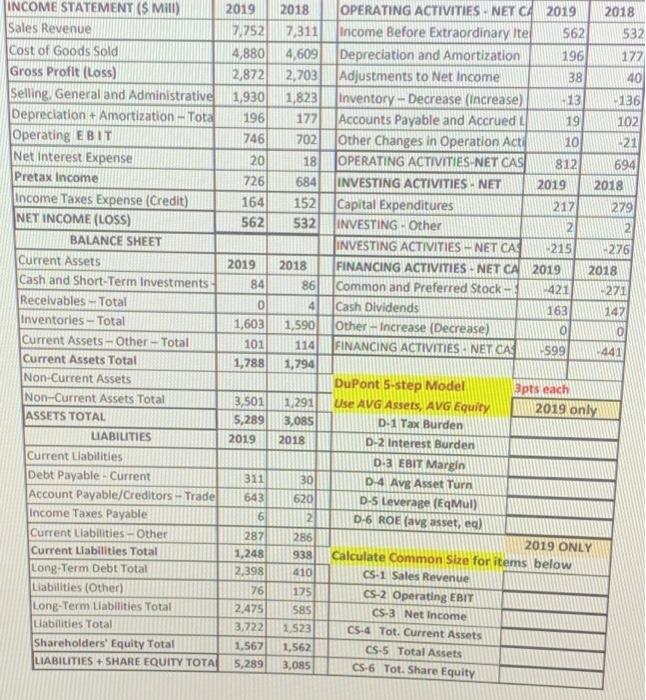
INCOME STATEMENT (S Mill) 2019 Sales Revenue 7,752 Cost of Goods Sold 4,880 Gross Profit (Loss) 2,872 Selling General and Administrative 1,930 Depreciation + Amortization - Tota 196 Operating EBIT 746 Net Interest Expense 20 Pretax income 726 Income Taxes Expense (Credit) 164 NET INCOME (LOSS) 562 BALANCE SHEET Current Assets 2019 Cash and Short-Term Investments 84 Receivables - Total 0 Inventories - Total 1,603 Current Assets -Other-Total 101 Current Assets Total 1,788 Non-Current Assets Non-Current Assets Total 3,501 ASSETS TOTAL 5,289 LIABILITIES 2019 Current Liabilities Debt Payable. Current 311 Account Payable/Creditors -- Trade 643 Income Taxes Payable 6 Current Liabilities - Other 287 Current Liabilities Total 1,248 Long-Term Debt Total 2398 Liabilities (Other) 76 Long-Term Liabilities Total 2.475 Llabilities Total 3,722 Shareholders' Equity Total 1,567 LIABILITIES + SHARE EQUITY TOTA 5,289 2018 OPERATING ACTIVITIES. NET CA 2019 2018 7.311 Income Before Extraordinary Ite 562 532 4,609 Depreciation and Amortization 196 177 2,703 Adjustments to Net Income 38 40 1,823 Inventory-Decrease (increase) -13 136 177 Accounts Payable and Accrued 19 102 702 Other Changes in Operation Acti 10 121 18 OPERATING ACTIVITIES-NET CAS 812 694 684 INVESTING ACTIVITIES - NET 2019 2018 152 Capital Expenditures 217 279 532 INVESTING - Other 2 INVESTING ACTIVITIES - NET CA 215 276 2018 FINANCING ACTIVITIES - NET CA 2019 2018 86 Common and Preferred Stock- 421 -271 4 Cash Dividends 163 1147 1,590 Other - Increase (Decrease) 0 114 FINANCING ACTIVITIES NET CA 599 441 1,794 DuPont 5-step Model 3pts each 1.291 Use AVG Assets, AVG Equity 2019 only 3,085 D-1 Tax Burden 2018 D-2 Interest Burden D-3 EBIT Margin 30 D-4 Avg Asset Turn 620 D-5 Leverage (EqMul 2 D-6 ROE (avg asset, eg) 286 2019 ONLY 938 Calculate Common Size for items below 410 CS-1 Sales Revenue 175 CS-2 Operating EBIT 585 CS-3 Net Income 2.523 CS-4 Tot. Current Assets 1,562 CS-5 Total Assets 3,085 CS-6 Tot. Share Equity