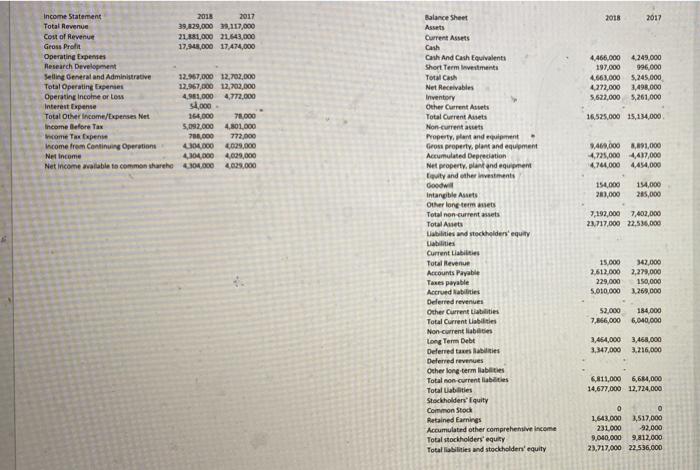
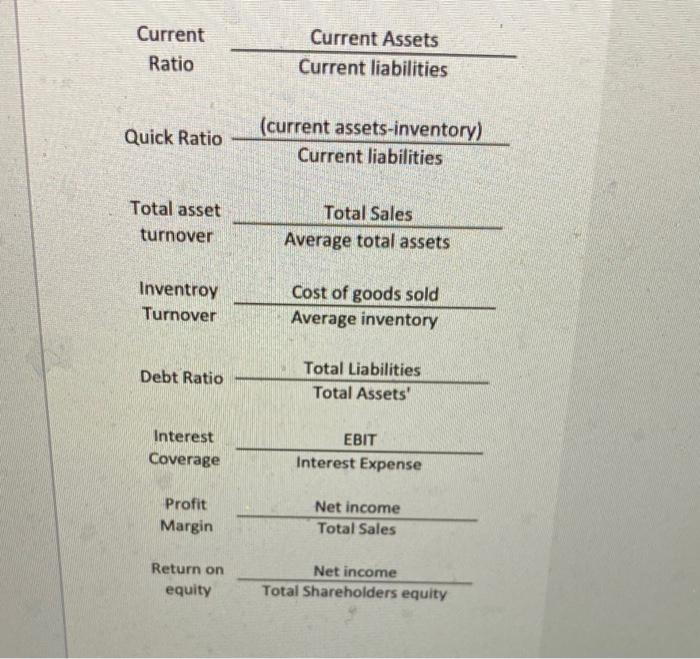
Income Statement Total Revenue Cost of Revenue Gross Profit Operating Expenses Research Development Selling General and Administrative Total Operating Expenses Operating Income or Loss Interest Expense Total Other Income/Expenses Net Income Before Tax come Tax Expense Income from Continuing Operations 2018 2017 39,829,000 39,117,000 21.881,000 21,643,000 17,948,000 17,474,000 12,967,000 12,702,000 12.967,000 12,702,000 4,961,000 4,772,000 $4,000. 164,000 5,092,000 788,000 78,000 4,801,000 772,000 4304,000 4,029,000 Net Income 4,304,000 4,029,000 Net Income available to common shareho 4304,000 4,029,000 Balance Sheet Assets Current Assets Cash Cash And Cash Equivalents Short Term Investments Total Cash Net Receivables Inventory Other Current Assets Total Current Assets Non-current assets Property, plant and equipment Gross property, plant and equipment Accumulated Depreciation Net property, plant and equipment Equity and other investments Goodwill Intangible Assets) Other long-term assets Total non-current assets Total Assets Liabilities and stockholders' equity Liabilities Current Liabilities Total Revenue Accounts Payable Taxes payable Accrued abilities Deferred revenues Other Current Liabilities Total Current Liabilities Non-current liabilities Long Term Debt Deferred taxes abilities Deferred revenues Other long-term liabilities Total non-current liabilities Total Liabilities Stockholders' Equity Common Stock Retained Earnings Accumulated other comprehensive income Total stockholders' equity Total liabilities and stockholders' equity 2018 4,466,000 4,249,000 197,000 996,000 4,661,000 5,245,000 4,272,000 3,498,000 5,622,000 5,261,000 16,525,000 15,134,000 2017 9,469,000 8,891,000 4,725,000 4,437,000 4,744,000 4,454,000 154,000 154,000 283,000 285,000 7,192,000 7,402,000 23,717,000 22,536,000 15,000 342,000 2,279,000 150,000 2,612,000 229,000 5,010,000 3,269,000 52,000 184,000 7,866,000 6,040,000 3,464,000 3,468,000 3,347,000 3,216,000 6,811,000 6,684,000 14,677,000 12,724,000 0 0 1,643,000 3,517,000 231,000 -92,000 9,040,000 9,812,000 23,717,000 22.536.000 Current Ratio Quick Ratio Total asset turnover Inventroy Turnover Debt Ratio Interest Coverage Profit Margin Return on equity Current Assets Current liabilities (current assets-inventory) Current liabilities Total Sales Average total assets Cost of goods sold Average inventory Total Liabilities Total Assets' EBIT Interest Expense Net income Total Sales Net income Total Shareholders equity


