Income vs. Cash Flow and Benchmarking Analysis
-
- Refer to the Baseline - projected income statement and statement of cash.
- Compute PDAs Quality of Income. Formulate this computation into the Baseline model near or with the benchmarking ratios instead of creating a new worksheet.
Quality of Income= Operating Cash FlowNet Income
Where, Operating Cash Flow = Cash Collections Cash Disbursements before Capital Acquisitions
Interpret this result and what information does this result provide to management?
- Explain why income is greater than cash flow and identify at least two specific areas in which PDA may not be effectively using cash (focus on working capital components).
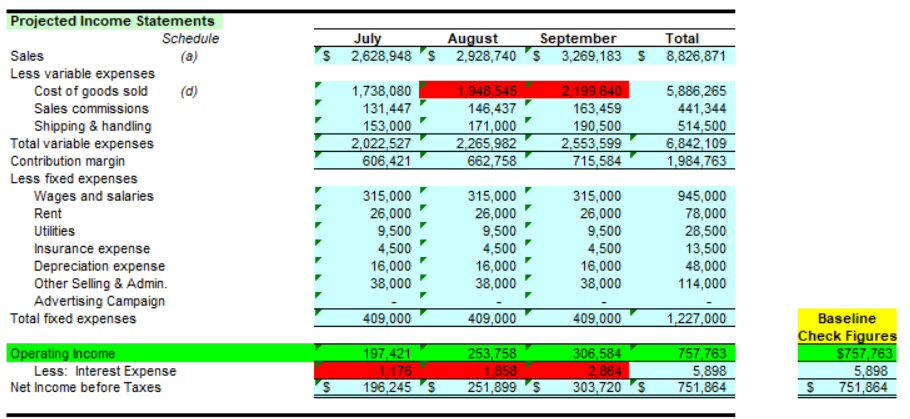
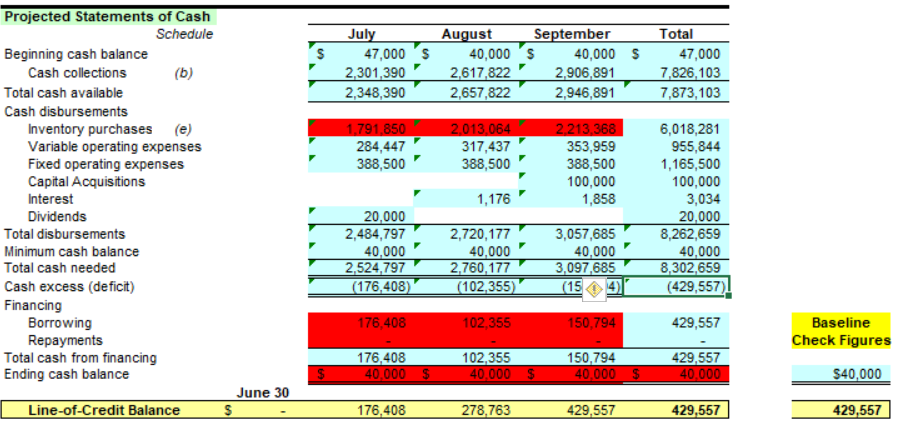
'$ July 2,628,948 '$ August September 2,928,740'S 3,269,183 $ Total 8,826,871 1,738,080 131,447 153,000 2,022,527 606,421 1,948 545 146,437 146,437 171,000 2.265,982' 662,758 2,199,640 163,459 16 190,500 2,553,599 715,584 5,886,265 441,344 514,500 6,842,109 1,984,763 Projected Income Statements Schedule Sales (a) Less variable expenses Cost of goods sold (d) Sales commissions Shipping & handling Total variable expenses Contribution margin Less fixed expenses Wages and salaries Rent Utilities Insurance expense Depreciation expense Other Selling & Admin. Advertising Campaign Total fixed expenses 315,000 26,000 9,500 4,500 16,000 38,000 315,000 26,000 9,500 4,500 16,000 38,000 315,000 26,000 9,500 4,500 16,000 38,000 945,000 78,000 28,500 13,500 48,000 114,000 409,000 409,000 409,000 1.227.000 7 Operating Income Less: Interest Expense Net Income before Taxes 197,421 1,176 196,245 253,758 1,858 251,899 $ 306,584 2,864 303,720 57,763 5,898 751,864 Baseline Check Figures $757,763 5,898 $ 751,864 S $ llections July 47,000'S 2,301,390 2,348,390 August September 40,000'S 40,000 2,617,822 2 ,906,89 2,657,822 2,946,891 Total 47,000 7,826,103 7,873,103 (b) 1.791,850 284,447" 388,500' 2.013,064 317,437 388,500 Projected Statements of Cash Schedule Beginning cash balance Cash collections Total cash available Cash disbursements Inventory purchases (e) Variable operating expenses Fixed operating expenses Capital Acquisitions Interest Dividends Total disbursements Minimum cash balance Total cash needed Cash excess (deficit) Financing Borrowing Repayments Total cash from financing Ending cash balance 2.213,368 353,959 388,500 100,000 1,858 1,176 6,018,281 955,844 1,165,500 100,000 3,034 20,000 8,262,659 40,000 8,302,659 (429,557) 3 20.000 2,484,797 40,000 2,524,797 (176,408) 2,720,177 40.000 2,760,177 (102,355) 3 ,057,685 40,000 ,097,685 (154 176,408 102,355 150,794 429,557 Baseline Check Figures 4 $ 176,408 40.000 $ 102,355 40.000 $ 150,794 40,000 $ 29,557 40.000 $40,000 June 30 Line-of-Credit Balance S 176,408 278,763 429,557 4 29,557 429,557 '$ July 2,628,948 '$ August September 2,928,740'S 3,269,183 $ Total 8,826,871 1,738,080 131,447 153,000 2,022,527 606,421 1,948 545 146,437 146,437 171,000 2.265,982' 662,758 2,199,640 163,459 16 190,500 2,553,599 715,584 5,886,265 441,344 514,500 6,842,109 1,984,763 Projected Income Statements Schedule Sales (a) Less variable expenses Cost of goods sold (d) Sales commissions Shipping & handling Total variable expenses Contribution margin Less fixed expenses Wages and salaries Rent Utilities Insurance expense Depreciation expense Other Selling & Admin. Advertising Campaign Total fixed expenses 315,000 26,000 9,500 4,500 16,000 38,000 315,000 26,000 9,500 4,500 16,000 38,000 315,000 26,000 9,500 4,500 16,000 38,000 945,000 78,000 28,500 13,500 48,000 114,000 409,000 409,000 409,000 1.227.000 7 Operating Income Less: Interest Expense Net Income before Taxes 197,421 1,176 196,245 253,758 1,858 251,899 $ 306,584 2,864 303,720 57,763 5,898 751,864 Baseline Check Figures $757,763 5,898 $ 751,864 S $ llections July 47,000'S 2,301,390 2,348,390 August September 40,000'S 40,000 2,617,822 2 ,906,89 2,657,822 2,946,891 Total 47,000 7,826,103 7,873,103 (b) 1.791,850 284,447" 388,500' 2.013,064 317,437 388,500 Projected Statements of Cash Schedule Beginning cash balance Cash collections Total cash available Cash disbursements Inventory purchases (e) Variable operating expenses Fixed operating expenses Capital Acquisitions Interest Dividends Total disbursements Minimum cash balance Total cash needed Cash excess (deficit) Financing Borrowing Repayments Total cash from financing Ending cash balance 2.213,368 353,959 388,500 100,000 1,858 1,176 6,018,281 955,844 1,165,500 100,000 3,034 20,000 8,262,659 40,000 8,302,659 (429,557) 3 20.000 2,484,797 40,000 2,524,797 (176,408) 2,720,177 40.000 2,760,177 (102,355) 3 ,057,685 40,000 ,097,685 (154 176,408 102,355 150,794 429,557 Baseline Check Figures 4 $ 176,408 40.000 $ 102,355 40.000 $ 150,794 40,000 $ 29,557 40.000 $40,000 June 30 Line-of-Credit Balance S 176,408 278,763 429,557 4 29,557 429,557