Question
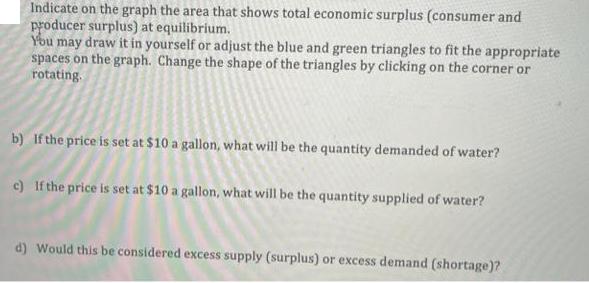
Indicate on the graph the area that shows total economic surplus (consumer and producer surplus) at equilibrium. You may draw it in yourself or


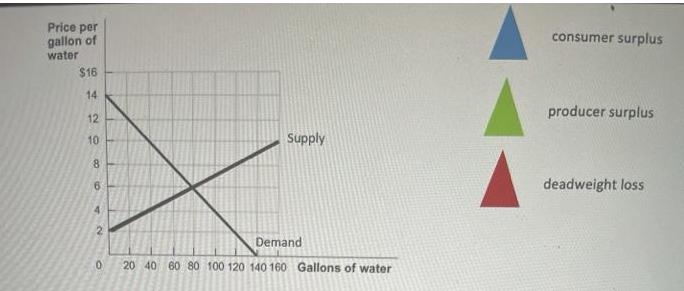
Indicate on the graph the area that shows total economic surplus (consumer and producer surplus) at equilibrium. You may draw it in yourself or adjust the blue and green triangles to fit the appropriate spaces on the graph. Change the shape of the triangles by clicking on the corner or rotating. b) If the price is set at $10 a gallon, what will be the quantity demanded of water? c) If the price is set at $10 a gallon, what will be the quantity supplied of water? d) Would this be considered excess supply (surplus) or excess demand (shortage)? Price per gallon of water $16 14 12 10 8 6 NA 4 2 Supply Demand 0 20 40 60 80 100 120 140 160 Gallons of water consumer surplus producer surplus deadweight loss
Step by Step Solution
3.34 Rating (154 Votes )
There are 3 Steps involved in it
Step: 1

Get Instant Access to Expert-Tailored Solutions
See step-by-step solutions with expert insights and AI powered tools for academic success
Step: 2

Step: 3

Ace Your Homework with AI
Get the answers you need in no time with our AI-driven, step-by-step assistance
Get StartedRecommended Textbook for
Economics
Authors: R. Glenn Hubbard
6th edition
978-0134797731, 134797736, 978-0134106243
Students also viewed these Accounting questions
Question
Answered: 1 week ago
Question
Answered: 1 week ago
Question
Answered: 1 week ago
Question
Answered: 1 week ago
Question
Answered: 1 week ago
Question
Answered: 1 week ago
Question
Answered: 1 week ago
Question
Answered: 1 week ago
Question
Answered: 1 week ago
Question
Answered: 1 week ago
Question
Answered: 1 week ago
Question
Answered: 1 week ago
Question
Answered: 1 week ago
Question
Answered: 1 week ago
Question
Answered: 1 week ago
Question
Answered: 1 week ago
Question
Answered: 1 week ago
Question
Answered: 1 week ago
Question
Answered: 1 week ago
Question
Answered: 1 week ago
Question
Answered: 1 week ago
Question
Answered: 1 week ago
View Answer in SolutionInn App


