Answered step by step
Verified Expert Solution
Question
1 Approved Answer
Individual Assignment #4 Revised Course: 52:630:360:02 Fall 2021 Due 11/16/2021 Read the case Hi Ho Silver at the end of Chapter 4. Review the scenario
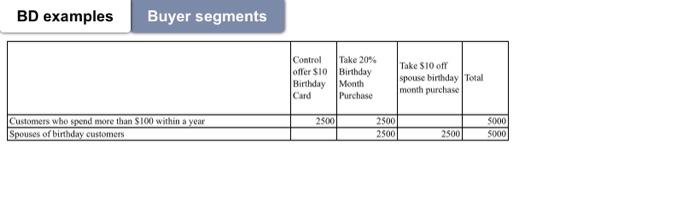
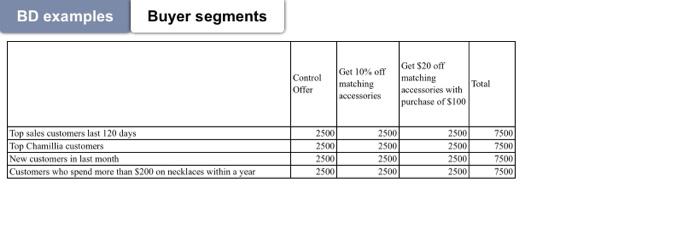
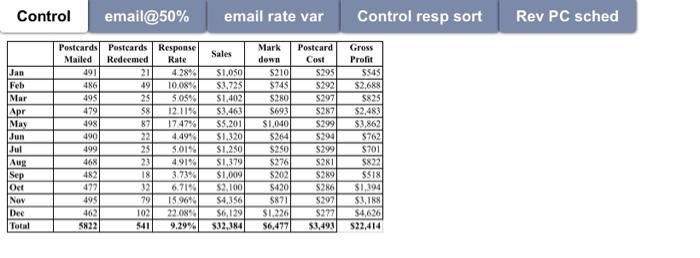
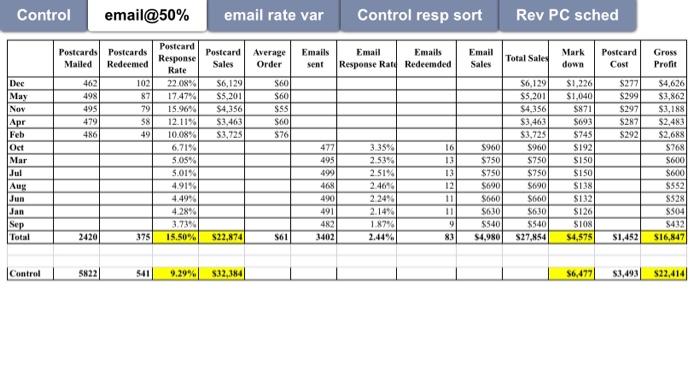
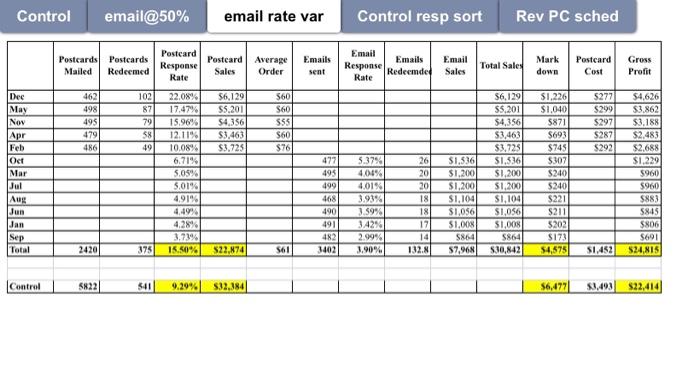
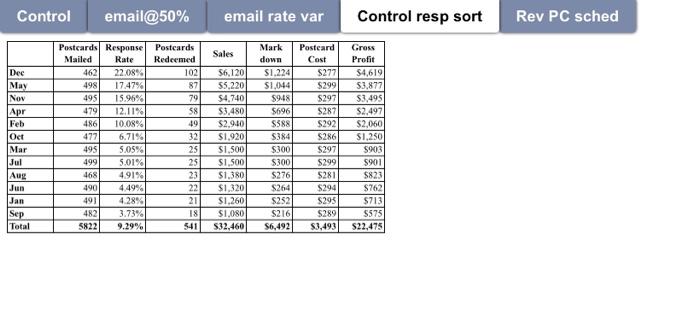
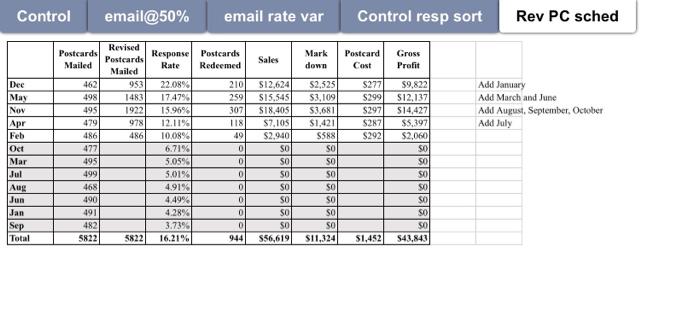 Individual Assignment #4 Revised Course: 52:630:360:02 Fall 2021 Due 11/16/2021 Read the case Hi Ho Silver at the end of Chapter 4. Review the scenario worksheets we discussed in class. After reviewing this information, write a 2 to 3-page paper where you discuss test scenarios to improve the results of the 925 club promotions (see Discussion Question 2 on p 190) and the Miss You campaign (see Discussion Question 3 on p 190). .925 Club Promotions Consider the types of tests that spiller discusses on p 141-144: List tests, Offer tests, Creative tests, and Contact Strategy tests. You should consider multiple tests for both the 925 club which can include information available from the Hi Ho Silver database as well as outside resources such as rental list segments that match the geo-demographic characteristics of the Hi Ho Silver buyer. Your description of each test should include the following in narrative form: Specify the objective of your test - what are you trying to learn? Describe Hi Ho Silver's control position, (i.e., what they are currently doing in direct mail to .925 club members. Tell what you are proposing to test to improve their results (e.g., additional list segments from the database or outside lists, new creative, new offers, new timing, etc.) . Tell how you will evaluate the results of your test, e.g., number of discount redemptions vs the control position through coupon codes, store visits, increased sales, etc. Consider the information that Hi Ho Silver has in the customer database (see p 183) and how you might use it to craft special offers to different customer segments. In addition to standard demographic data, you might consider things like spouse name, loyalty number, brand preferences, etc. Refer to the workbook .925 Club scenarios included in this assignment. While we don't know the exact number of people in the database, or the number who might be in each segment you propose reaching, you can speculate about the quantities you'll put in each test cell. The zip code chart on shown on p 188 shows some 30,000 customers in 6 different zip codes, so let's assume that there might be as many as 50,000 total. Make sure your quantities are realistic based on the number of people who might be in the database. Create a test matrix that shows the list segments you propose using as the rows, and the different products, offers or creative executions you'd like to test. You should have at least four tests. Use as many rows or columns as you need for the tests that you specify, and fill in your proposed quantities for each test cell. For example: Test A Test B Test nth Total (Description) (Description) (Description) List segment QTY OTY OTY List segment QTY QTY OTY th Miss You Campaign For the Miss You campaign, we reviewed two different strategies in class for changing the contact strategy for this program. The first involved substituting email for postcards in the low responding months. The second involved increasing the mail quantities in the best responding months by moving the eligible Miss You prospects into the top responding mail months. Your paper should: Explain the response rate assumptions and the revenue assumptions we made when developing the financial projections for each of these strategies. What impact can each of these strategies have on the number of orders, sales revenue, and profit for this program? What would happen if these assumptions are not met? How and when would you measure the success or failure of each strategy? Due 11/16/2021 Submit on Canvas BD examples Buyer segments Control Take 20% offer $10 Birthday Birthday Month Card Purchase Take $10 of spouse birthday Total month purchase 2500 Customers who spend more than $100 within a year Spouses of birthday customers 2500 2500 5000 5000 2500 BD examples Buyer segments Control Offer Get 10% off matching accessories Get $20 off matching accessories with Total purchase of S100 2500 Top sales customers last 120 days Top Chamillia customers New customers in last month Customers who spend more than $200 on necklaces within a year 2000 2500 2500 2500 2500 2500 2500 2500 2500 2500 2500 7500 7500 7500 7500 Control email@50% email rate var Control resp sort Rev PC sched Sales Postcard Cost 5295 Jan Feb Mar Apr May Jun Jul Aug Sep Oct Nov Dee Total Postcards Posteards Response Mailed Redeemed Rate 491 21 4.28% 486 49 10.08% 495 25 5.05% 479 58 12.11% 498 87 17.47% 490 4.49% 499 25 5019 468 23 491% 482 18 3.73% 477 32 6.71% 495 79 159654 462 102 22.08% 5822 541 9.29% $1,050 $3,725 $1,402 $3.463 S5.201 $1,3201 $1.250 $1,379 $1,009 $2,100 $4.356 $6,129 $32,384 Mark down 5210 $745 $280 S693 $1,040 $264 $250 $276 S202 S420 5871 S1.226 $6,4771 S292 5297 $287 $299 5294 $299 S28 S289 5286 5297 $277 $3,493 Gross Profit 55451 $2,688 5825 $2,483 $3.862 $762 $701 5822 5518 $1,394 $3,188 $4,626 S22,414 Control email@50% email rate var Control resp sort Rev PC sched Postcard Sales Emails sent Email Emails Response Rat Redeemded Email Sales Total Sales Gross Profit Postcards Posteards Mailed Redeemed 462 102 498 87 495 79 479 58 486 49 S6,129 $5,201 $4,356 $3,463 $3,725 Average Order S60 S60 SSS $60 S76 Dec May Nov Apr Feb Oct Mar Jul Aug Jun Jan Sep Total Postcard Response Rate 22.08% 17.47% 15.96% 12.11% 10.08% 6.71% 5.05% 5.01% 4.91% 4.49 4.28% 3.73% 15.50% 16 13 13 12 $4,626 $3,862 $3,188 $2,483 $2,688 $768 S600 477 495 499 468 4020 491 482 1402 S6,129 $5,201 $4.356 $3,463 $3,725 5960 $750 $750 5600 S660 5630 $540 $27,854 3.35% 2.53% 2.51% 2.4674 2.24% 2.14% 1.8794 2.44% S600 Mark Postcard down Cost $1,226 $277 $1,040 $299 $871 $297 $693 S287 $745 S292 S192 S150 SISO S138 $132 S126 S108 $4,575 $1,452 5960 $750 $750 $690 S660 $630 5540 $4.980 11 11 9 8) $552 S528 S504 $432 $16,847 2420 375 $22,874 S61 Control 5822 541 9.29%832,384 S6,4771 53,493 $22,414 Control email@50% email rate var Control resp sort Rev PC sched Mark Postcards Postcards Mailed Redeemed Postcard Response Rate Postcard Sales Average Order Emails sent Email Emails Response Redeemded Rate Email Sales Total Sales down Postcard Cost Gross Profit 1021 Dec May Now 462 498 495 479 486 87 79 58 56,129 $5.201 54.356 $3.463 $3.725 560 S60 $55 $60 $76 5277 $299 $297 $287 $292 Apr Feb 49 Oct Mar Jul Aug Jun 22.08% 17.47% 15.96% 12.11% 10.08% 6.71% 5.05% 5.01% 4,91% 4.49% 4.28% 3.7396 15.50% 477 495 499 468 490 491 482 1402 5.37% 4.04% 4.01% 3.93% 3.59% 3.42% 2.99% 3.90% 26 20 20 18 18 17 14 132.N $1,536 $1.200 $1,200 $1,104 $1,056 $1,008 5864 57,968 56,1291 $5,201 $4,356 $3,463 $3.723 $1,536 S1,200 $1.200 SI,104 $1.056 $1,008 5864 5.30,842 $1.226 $1,040 5871 $693 $745 $307 $240 $240 $221 $211 5202 $173 54.675 $4,626 $3.862 $3.188 $2.483 $2.688 $1.229 5960 5960 $883 5845 $806 $691 $24.815 Jan Sep Total 2420 375 522,174 561 S1,452 Control 5822 541 9.29% 532,384 $6,477 $3,493 $22,414 Control email@50% email rate var Control resp sort Rev PC sched Sales Dec May Nov Apr Feb Postcards Redeemed 102 87 79 58 19 Oct Postcards Response Mailed Rate 462 22.08% 498 17.479 495 15.95% 479 12.11% 486 10.08% 477 6.71% 495 5.05% 499 5.01% 468 4919 490 4.49% 4.28% 482 3.73% 5822 9.29% 32 25 25 23 22 21 18 541 Mark down $1.224 $1.044 $948 $696 SSR8 $384 $300 $300 $276 S264 $252 S216 S6,492 56,120 55.220 $4,740 $3.480 $2.9.10 $1.920 $1,500 SI 500 $1,380 $1,320 $1,260 $1.080 S32,460 Posteard Cost $277 $299 $297 $287 $292 S286 $297 $299 5281 $294 S2931 $289 $3,493 Mar Jul Aug Jun Jan Sep Total Gross Profit $4,619 $3,877 $3,495 52,497 $2,060 $1,250 5003 5901 $823 $762 $713 5575 S22,475 493 Control email@50% email rate var Control resp sort Rev PC sched Postcards Mailed Sales Mark down Postcard Cost Gross Profit Dee May Nov Apr Feb 462 498 495 479 486 Revised Postcards Mailed 953 1483 1922 978 486 S277 $299 5297 5287 S292 Add January Add March and June Add August, September October Add July S12,624 $15.545 $18,405 57,105 $2.940 SO SO SO SO Oct Response Postcards Rate Redeemed 22.08% 210 17.479 259 15.96% 307 12.11% 118 10.08% 49 6.71% 0 5.0594 0 5.01% 4.91% 0 4.49% 0 4.28% 0 3.7396 0 16.21% 944 472 Mar Jul Aug Jun Jan Sep Total 495 499 468 490 491 482 5822 $2,525 53,109 53,681 $1,421 S5881 SO SO SO SO SO SO SO $11.324 $9.822 $12,137 $14,427 $5,397 $2,060 SO so 0 SO SO SO SO 543.843 SO SO SO 556,6191 58221 $1,452 Individual Assignment #4 Revised Course: 52:630:360:02 Fall 2021 Due 11/16/2021 Read the case Hi Ho Silver at the end of Chapter 4. Review the scenario worksheets we discussed in class. After reviewing this information, write a 2 to 3-page paper where you discuss test scenarios to improve the results of the 925 club promotions (see Discussion Question 2 on p 190) and the Miss You campaign (see Discussion Question 3 on p 190). .925 Club Promotions Consider the types of tests that spiller discusses on p 141-144: List tests, Offer tests, Creative tests, and Contact Strategy tests. You should consider multiple tests for both the 925 club which can include information available from the Hi Ho Silver database as well as outside resources such as rental list segments that match the geo-demographic characteristics of the Hi Ho Silver buyer. Your description of each test should include the following in narrative form: Specify the objective of your test - what are you trying to learn? Describe Hi Ho Silver's control position, (i.e., what they are currently doing in direct mail to .925 club members. Tell what you are proposing to test to improve their results (e.g., additional list segments from the database or outside lists, new creative, new offers, new timing, etc.) . Tell how you will evaluate the results of your test, e.g., number of discount redemptions vs the control position through coupon codes, store visits, increased sales, etc. Consider the information that Hi Ho Silver has in the customer database (see p 183) and how you might use it to craft special offers to different customer segments. In addition to standard demographic data, you might consider things like spouse name, loyalty number, brand preferences, etc. Refer to the workbook .925 Club scenarios included in this assignment. While we don't know the exact number of people in the database, or the number who might be in each segment you propose reaching, you can speculate about the quantities you'll put in each test cell. The zip code chart on shown on p 188 shows some 30,000 customers in 6 different zip codes, so let's assume that there might be as many as 50,000 total. Make sure your quantities are realistic based on the number of people who might be in the database. Create a test matrix that shows the list segments you propose using as the rows, and the different products, offers or creative executions you'd like to test. You should have at least four tests. Use as many rows or columns as you need for the tests that you specify, and fill in your proposed quantities for each test cell. For example: Test A Test B Test nth Total (Description) (Description) (Description) List segment QTY OTY OTY List segment QTY QTY OTY th Miss You Campaign For the Miss You campaign, we reviewed two different strategies in class for changing the contact strategy for this program. The first involved substituting email for postcards in the low responding months. The second involved increasing the mail quantities in the best responding months by moving the eligible Miss You prospects into the top responding mail months. Your paper should: Explain the response rate assumptions and the revenue assumptions we made when developing the financial projections for each of these strategies. What impact can each of these strategies have on the number of orders, sales revenue, and profit for this program? What would happen if these assumptions are not met? How and when would you measure the success or failure of each strategy? Due 11/16/2021 Submit on Canvas BD examples Buyer segments Control Take 20% offer $10 Birthday Birthday Month Card Purchase Take $10 of spouse birthday Total month purchase 2500 Customers who spend more than $100 within a year Spouses of birthday customers 2500 2500 5000 5000 2500 BD examples Buyer segments Control Offer Get 10% off matching accessories Get $20 off matching accessories with Total purchase of S100 2500 Top sales customers last 120 days Top Chamillia customers New customers in last month Customers who spend more than $200 on necklaces within a year 2000 2500 2500 2500 2500 2500 2500 2500 2500 2500 2500 7500 7500 7500 7500 Control email@50% email rate var Control resp sort Rev PC sched Sales Postcard Cost 5295 Jan Feb Mar Apr May Jun Jul Aug Sep Oct Nov Dee Total Postcards Posteards Response Mailed Redeemed Rate 491 21 4.28% 486 49 10.08% 495 25 5.05% 479 58 12.11% 498 87 17.47% 490 4.49% 499 25 5019 468 23 491% 482 18 3.73% 477 32 6.71% 495 79 159654 462 102 22.08% 5822 541 9.29% $1,050 $3,725 $1,402 $3.463 S5.201 $1,3201 $1.250 $1,379 $1,009 $2,100 $4.356 $6,129 $32,384 Mark down 5210 $745 $280 S693 $1,040 $264 $250 $276 S202 S420 5871 S1.226 $6,4771 S292 5297 $287 $299 5294 $299 S28 S289 5286 5297 $277 $3,493 Gross Profit 55451 $2,688 5825 $2,483 $3.862 $762 $701 5822 5518 $1,394 $3,188 $4,626 S22,414 Control email@50% email rate var Control resp sort Rev PC sched Postcard Sales Emails sent Email Emails Response Rat Redeemded Email Sales Total Sales Gross Profit Postcards Posteards Mailed Redeemed 462 102 498 87 495 79 479 58 486 49 S6,129 $5,201 $4,356 $3,463 $3,725 Average Order S60 S60 SSS $60 S76 Dec May Nov Apr Feb Oct Mar Jul Aug Jun Jan Sep Total Postcard Response Rate 22.08% 17.47% 15.96% 12.11% 10.08% 6.71% 5.05% 5.01% 4.91% 4.49 4.28% 3.73% 15.50% 16 13 13 12 $4,626 $3,862 $3,188 $2,483 $2,688 $768 S600 477 495 499 468 4020 491 482 1402 S6,129 $5,201 $4.356 $3,463 $3,725 5960 $750 $750 5600 S660 5630 $540 $27,854 3.35% 2.53% 2.51% 2.4674 2.24% 2.14% 1.8794 2.44% S600 Mark Postcard down Cost $1,226 $277 $1,040 $299 $871 $297 $693 S287 $745 S292 S192 S150 SISO S138 $132 S126 S108 $4,575 $1,452 5960 $750 $750 $690 S660 $630 5540 $4.980 11 11 9 8) $552 S528 S504 $432 $16,847 2420 375 $22,874 S61 Control 5822 541 9.29%832,384 S6,4771 53,493 $22,414 Control email@50% email rate var Control resp sort Rev PC sched Mark Postcards Postcards Mailed Redeemed Postcard Response Rate Postcard Sales Average Order Emails sent Email Emails Response Redeemded Rate Email Sales Total Sales down Postcard Cost Gross Profit 1021 Dec May Now 462 498 495 479 486 87 79 58 56,129 $5.201 54.356 $3.463 $3.725 560 S60 $55 $60 $76 5277 $299 $297 $287 $292 Apr Feb 49 Oct Mar Jul Aug Jun 22.08% 17.47% 15.96% 12.11% 10.08% 6.71% 5.05% 5.01% 4,91% 4.49% 4.28% 3.7396 15.50% 477 495 499 468 490 491 482 1402 5.37% 4.04% 4.01% 3.93% 3.59% 3.42% 2.99% 3.90% 26 20 20 18 18 17 14 132.N $1,536 $1.200 $1,200 $1,104 $1,056 $1,008 5864 57,968 56,1291 $5,201 $4,356 $3,463 $3.723 $1,536 S1,200 $1.200 SI,104 $1.056 $1,008 5864 5.30,842 $1.226 $1,040 5871 $693 $745 $307 $240 $240 $221 $211 5202 $173 54.675 $4,626 $3.862 $3.188 $2.483 $2.688 $1.229 5960 5960 $883 5845 $806 $691 $24.815 Jan Sep Total 2420 375 522,174 561 S1,452 Control 5822 541 9.29% 532,384 $6,477 $3,493 $22,414 Control email@50% email rate var Control resp sort Rev PC sched Sales Dec May Nov Apr Feb Postcards Redeemed 102 87 79 58 19 Oct Postcards Response Mailed Rate 462 22.08% 498 17.479 495 15.95% 479 12.11% 486 10.08% 477 6.71% 495 5.05% 499 5.01% 468 4919 490 4.49% 4.28% 482 3.73% 5822 9.29% 32 25 25 23 22 21 18 541 Mark down $1.224 $1.044 $948 $696 SSR8 $384 $300 $300 $276 S264 $252 S216 S6,492 56,120 55.220 $4,740 $3.480 $2.9.10 $1.920 $1,500 SI 500 $1,380 $1,320 $1,260 $1.080 S32,460 Posteard Cost $277 $299 $297 $287 $292 S286 $297 $299 5281 $294 S2931 $289 $3,493 Mar Jul Aug Jun Jan Sep Total Gross Profit $4,619 $3,877 $3,495 52,497 $2,060 $1,250 5003 5901 $823 $762 $713 5575 S22,475 493 Control email@50% email rate var Control resp sort Rev PC sched Postcards Mailed Sales Mark down Postcard Cost Gross Profit Dee May Nov Apr Feb 462 498 495 479 486 Revised Postcards Mailed 953 1483 1922 978 486 S277 $299 5297 5287 S292 Add January Add March and June Add August, September October Add July S12,624 $15.545 $18,405 57,105 $2.940 SO SO SO SO Oct Response Postcards Rate Redeemed 22.08% 210 17.479 259 15.96% 307 12.11% 118 10.08% 49 6.71% 0 5.0594 0 5.01% 4.91% 0 4.49% 0 4.28% 0 3.7396 0 16.21% 944 472 Mar Jul Aug Jun Jan Sep Total 495 499 468 490 491 482 5822 $2,525 53,109 53,681 $1,421 S5881 SO SO SO SO SO SO SO $11.324 $9.822 $12,137 $14,427 $5,397 $2,060 SO so 0 SO SO SO SO 543.843 SO SO SO 556,6191 58221 $1,452
Step by Step Solution
There are 3 Steps involved in it
Step: 1

Get Instant Access to Expert-Tailored Solutions
See step-by-step solutions with expert insights and AI powered tools for academic success
Step: 2

Step: 3
Ace Your Homework with AI
Get the answers you need in no time with our AI-driven, step-by-step assistance
Get Started