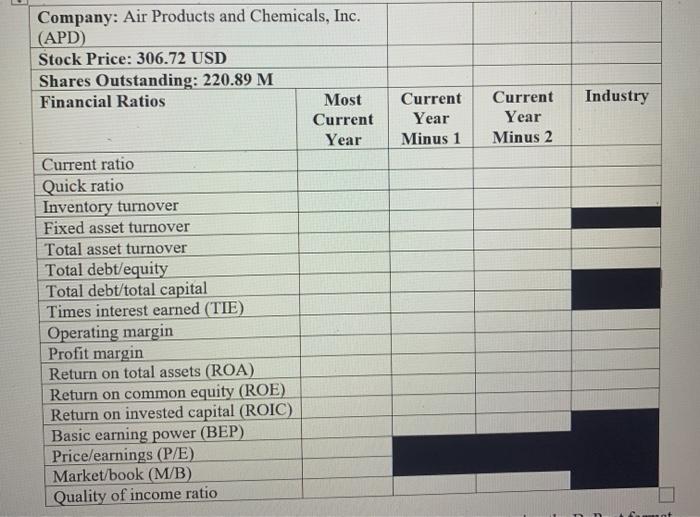
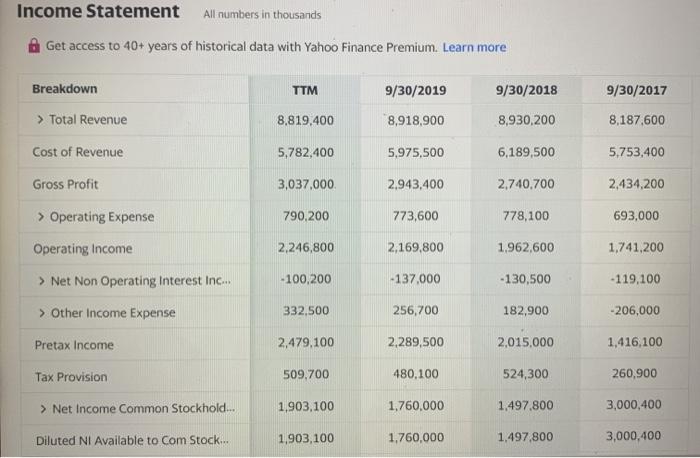
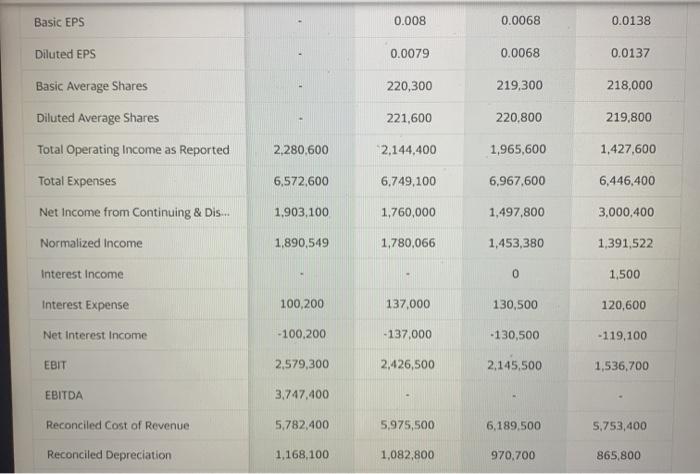
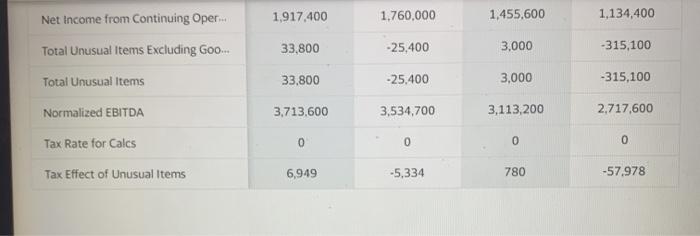
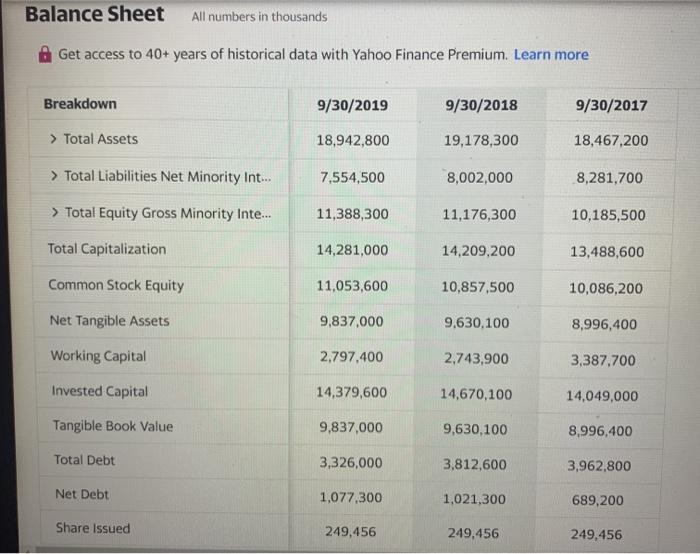
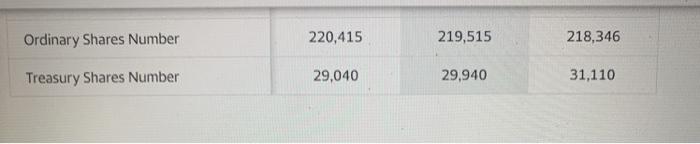
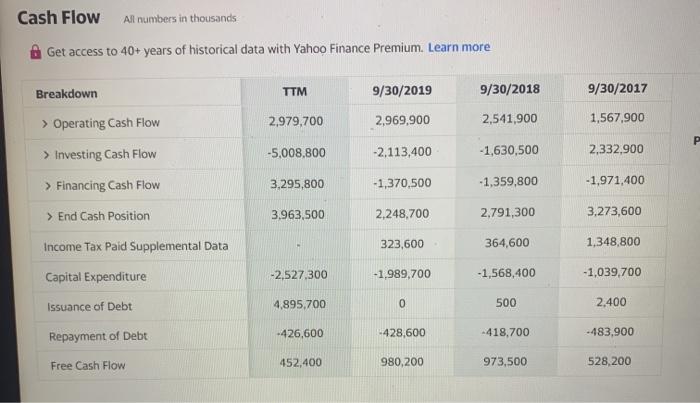
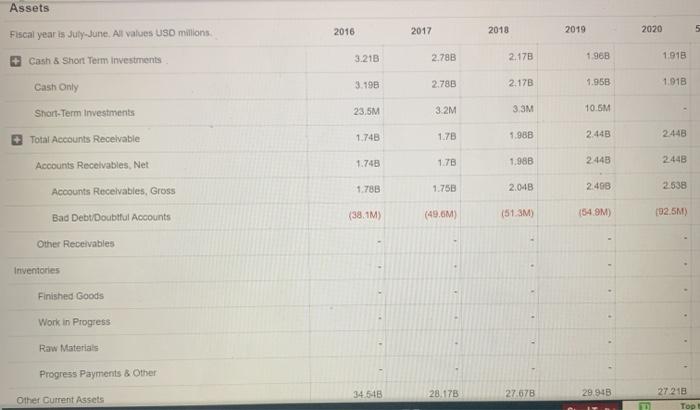
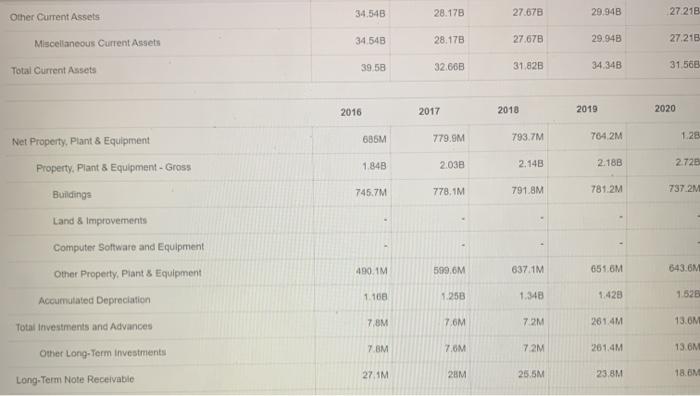
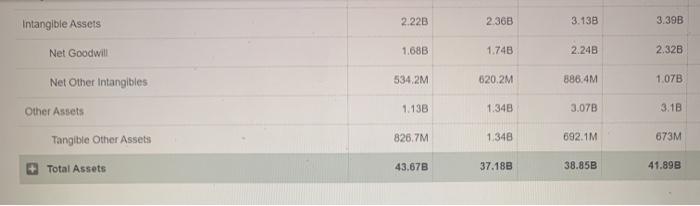
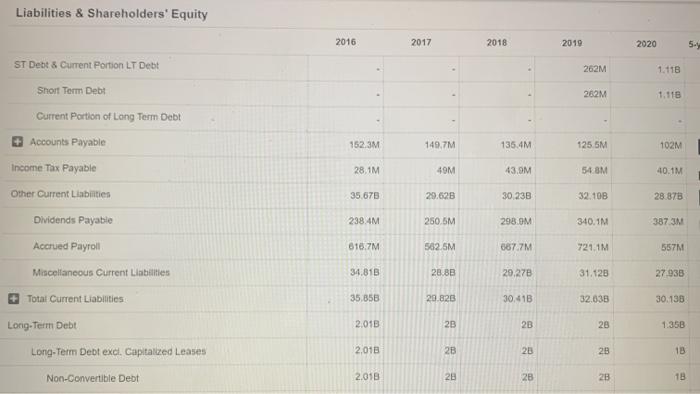
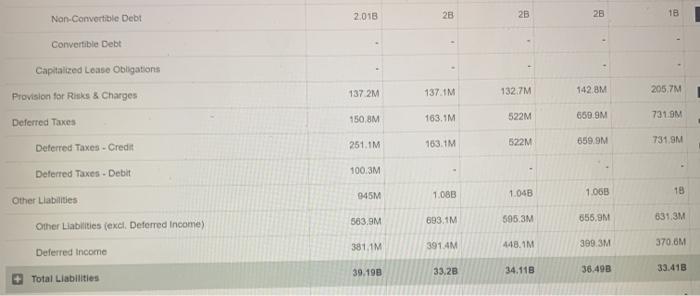
Industry Current Year Minus 1 Current Year Minus 2 Company: Air Products and Chemicals, Inc. (APD) Stock Price: 306.72 USD Shares Outstanding: 220.89 M Financial Ratios Most Current Year Current ratio Quick ratio Inventory turnover Fixed asset turnover Total asset turnover Total debt/equity Total debt/total capital Times interest earned (TIE) Operating margin Profit margin Return on total assets (ROA) Return on common equity (ROE) Return on invested capital (ROIC) Basic earning power (BEP) Price/earnings (P/E) Market/book (M/B) Quality of income ratio unt Income Statement All numbers in thousands Get access to 40+ years of historical data with Yahoo Finance Premium. Learn more TTM 9/30/2018 9/30/2017 Breakdown > Total Revenue 9/30/2019 8,918,900 8,819,400 8,930,200 8,187,600 Cost of Revenue 5,782,400 5,975,500 6,189,500 5.753,400 3,037,000 2,943.400 2.740.700 2,434,200 790,200 773,600 778,100 693,000 2,246,800 2,169,800 1.962,600 1,741,200 -100,200 -137.000 -130,500 -119,100 Gross Profit > Operating Expense Operating Income > Net Non Operating Interest Inc... > Other Income Expense Pretax Income Tax Provision > Net Income Common Stockhold... 332,500 256,700 182,900 -206,000 2,479,100 2.289,500 2,015,000 1,416,100 509,700 480,100 524,300 260,900 1,903,100 1,760,000 1,497.800 3,000,400 Diluted NI Available to Com Stock... 1,903,100 1,760,000 1.497.800 3,000,400 Basic EPS 0.008 0.0068 0.0138 Diluted EPS 0.0079 0.0068 0.0137 Basic Average Shares 220,300 219,300 218,000 Diluted Average Shares 221,600 220,800 219,800 2.280.600 2,144,400 1,965,600 1,427,600 6,572,600 6,749,100 6,967,600 6,446,400 Total Operating Income as Reported Total Expenses Net Income from Continuing & Dis... Normalized Income 1.903,100 1,760,000 1,497,800 3,000,400 1.890,549 1,780,066 1,453,380 1,391,522 Interest Income 0 1,500 Interest Expense 100,200 137,000 130,500 120,600 Net Interest Income -100,200 - 137,000 -130,500 -119,100 EBIT 2,579,300 2,426,500 2.145,500 1,536,700 EBITDA 3,747.400 5.782,400 5,975,500 6,189,500 5.753,400 Reconciled Cost of Revenue Reconciled Depreciation 1,168,100 1,082,800 970,700 865,800 1,917.400 1.760,000 1,455,600 1,134,400 33,800 -25.400 3,000 -315,100 Net Income from Continuing Oper... Total Unusual Items Excluding Goo... Total Unusual Items Normalized EBITDA Tax Rate for Calcs 33,800 -25.400 3,000 -315,100 3,713,600 3.534,700 3,113,200 2,717,600 0 0 0 0 Tax Effect of Unusual Items 6,949 -5,334 780 -57.978 Balance Sheet All numbers in thousands Get access to 40+ years of historical data with Yahoo Finance Premium. Learn more Breakdown 9/30/2019 9/30/2018 9/30/2017 > Total Assets 18,942,800 19,178,300 18,467,200 7.554,500 8,002,000 8,281,700 > Total Liabilities Net Minority Int... > Total Equity Gross Minority Inte... 11,388,300 11,176,300 10,185,500 Total Capitalization 14,281,000 14,209,200 13,488,600 Common Stock Equity 11,053,600 10,857,500 10,086,200 Net Tangible Assets 9,837,000 9,630,100 8,996,400 Working Capital 2,797,400 2.743,900 3,387.700 Invested Capital 14,379,600 14,670,100 14,049,000 Tangible Book Value 9,837,000 9,630,100 8,996,400 Total Debt 3,326,000 3,812,600 3,962,800 Net Debt 1,077,300 1,021,300 689,200 Share issued 249,456 249,456 249,456 Ordinary Shares Number 220,415 219,515 218,346 Treasury Shares Number 29,040 29,940 31,110 Cash Flow All numbers in thousands Get access to 40+ years of historical data with Yahoo Finance Premium. Learn more Breakdown TTM 9/30/2019 9/30/2018 9/30/2017 > Operating Cash Flow 2.979.700 2,969,900 2,541,900 1,567.900 P > Investing Cash Flow -5,008,800 -2.113,400 - 1,630,500 2,332,900 > Financing Cash Flow 3,295,800 -1,370.500 -1,359,800 - 1,971,400 3,963,500 2,248,700 2.791,300 3,273,600 > End Cash Position Income Tax Paid Supplemental Data 323,600 364,600 1,348,800 -2,527.300 -1,989,700 -1,568,400 -1,039,700 Capital Expenditure Issuance of Debt 4,895,700 0 500 2.400 -426,600 Repayment of Debt -428,600 -418,700 -483,900 Free Cash Flow 452,400 980,200 973,500 528,200 Assets 2016 2017 2018 2019 2020 Fiscal year is July June. All values USD millions 3.21B 2.78B 2.178 1.96B 1.918 3.198 Cash & Short Term investments Cash Only Short-Term Investments 2.788 2.17B 1.95B 1.013 23,5M 3.2M 3.3M 10.5M 1.78 2.443 Total Accounts Receivable 1.748 1.988 2448 1.748 1.78 1.988 2443 2448 1.783 1.758 2.04B 2.490 2538 Accounts Receivables, Net Accounts Receivables, Gross Bad Debt Doubtful Accounts Other Receivables 34 1M) (49.6M) (51.3M) (549M) (92.51) Inventories Finished Goods Work in Progress Raw Materials Progress Payments & Other 34 54B 28.17B 27.678 29.943 27 218 Other Current Assets Top 34 548 28.178 27.670 Other Current Assets 29.94B 27 218 Miscellaneous Current Assets 34 548 28.17B 27.678 29 94B 27.218 39 58 32.66B Total Current Assets 31.82B 34 34B 31.568 2016 2017 2018 2019 2020 685M 779.9M Net Property. Plant & Equipment 793.7M 764 2M 1.28 1.848 2.038 2.14B 2.18B Property. Plant & Equipment - Gross 2.725 745.7M 773 1M 791.8M Buildings 781.2M 737.2M Land & Improvements 490. IM 599,6M 637 1. Computer Software and Equipment Other Property, Plant & Equipment Accumulated Depreciation 651.6M 643 6M 1.100 1.250 1.348 1428 1528 7.8M 7,6M 7 2M 261.4M 13.0M Total Investments and Advances 7.BM 70M 7.2M 261.4M 13.6M Other Long-Term investments 27 AM 28M 25.5M 23.8M 18.0M Long Term Note Receivable 2.22B 2.36B 3.13B 3.39B Intangible Assets Net Goodwill 1.683 1.74B 2.24B 2.328 Net Other intangibles 534,2M 620.2M 886.4M 1.07B 1.13B 1.34B 3.07B 3.18 Other Assets Tangible Other Assets 826.7M 1.348 692 1M 673M Total Assets 43.678 37.18B 38.85B 41.89B Liabilities & Shareholders' Equity 2016 2017 2018 2019 2020 54 262M 1.118 262M 1.115 1523M 149.7M 135.4M 125 5M 102M 38 1M 49M 43.5M 54 8M 440.1M ST Dete & Current Portion LT Dett Short Term Debt Current Portion of Long Term Debt Accounts Payable Income Tax Payable Other Current Liabilities Dividends Payable Accrued Payroll Mascellaneous Current Liabilities Total Current Liabilities Long-Term Debt 35.678 29.628 30.23B 32.10B 28.878 238.4M 250.5M 298.9M 840 14 387 3M 616.7M 502.5M 667.7M 7211M 557M 34.81B 20 GB 29.278 31.128 27938 35,858 20.8263 30,413 32.63B 30.138 2.01B 20 2B 28 1.35B Long-Term Debt excl. Capitalized Leases 2018 28 2B 28 13 Non-Convertible Debt 2.018 28 28 2B 18 2018 2B 28 28 1B Non-Convertible Debt Convertible Debt 137 2M 137. IM 132.7M Capitalized Lease Obligations Provision for Risks & Charges Deferred Taxes 142 BM 205.7M 163, M 522M 659 9M 150,8M 731.9M 251 TM 1631M 522M 659.9M Deferred Taxes - Credit 731.9M 100.3M 945M 1.085 1.048 18 1.063 Deferred Taxes. Debit Other Liabilities Other Liabilities (excl. Deferred Income) 583.9M 693.1M 595.3M 655,8M 631,3M 381 M 391.4M 45.1M 389.3M 370 6M Deferred Income 39.198 33.28 34.110 36.49B 33.41B Total Liabilities Industry Current Year Minus 1 Current Year Minus 2 Company: Air Products and Chemicals, Inc. (APD) Stock Price: 306.72 USD Shares Outstanding: 220.89 M Financial Ratios Most Current Year Current ratio Quick ratio Inventory turnover Fixed asset turnover Total asset turnover Total debt/equity Total debt/total capital Times interest earned (TIE) Operating margin Profit margin Return on total assets (ROA) Return on common equity (ROE) Return on invested capital (ROIC) Basic earning power (BEP) Price/earnings (P/E) Market/book (M/B) Quality of income ratio unt Income Statement All numbers in thousands Get access to 40+ years of historical data with Yahoo Finance Premium. Learn more TTM 9/30/2018 9/30/2017 Breakdown > Total Revenue 9/30/2019 8,918,900 8,819,400 8,930,200 8,187,600 Cost of Revenue 5,782,400 5,975,500 6,189,500 5.753,400 3,037,000 2,943.400 2.740.700 2,434,200 790,200 773,600 778,100 693,000 2,246,800 2,169,800 1.962,600 1,741,200 -100,200 -137.000 -130,500 -119,100 Gross Profit > Operating Expense Operating Income > Net Non Operating Interest Inc... > Other Income Expense Pretax Income Tax Provision > Net Income Common Stockhold... 332,500 256,700 182,900 -206,000 2,479,100 2.289,500 2,015,000 1,416,100 509,700 480,100 524,300 260,900 1,903,100 1,760,000 1,497.800 3,000,400 Diluted NI Available to Com Stock... 1,903,100 1,760,000 1.497.800 3,000,400 Basic EPS 0.008 0.0068 0.0138 Diluted EPS 0.0079 0.0068 0.0137 Basic Average Shares 220,300 219,300 218,000 Diluted Average Shares 221,600 220,800 219,800 2.280.600 2,144,400 1,965,600 1,427,600 6,572,600 6,749,100 6,967,600 6,446,400 Total Operating Income as Reported Total Expenses Net Income from Continuing & Dis... Normalized Income 1.903,100 1,760,000 1,497,800 3,000,400 1.890,549 1,780,066 1,453,380 1,391,522 Interest Income 0 1,500 Interest Expense 100,200 137,000 130,500 120,600 Net Interest Income -100,200 - 137,000 -130,500 -119,100 EBIT 2,579,300 2,426,500 2.145,500 1,536,700 EBITDA 3,747.400 5.782,400 5,975,500 6,189,500 5.753,400 Reconciled Cost of Revenue Reconciled Depreciation 1,168,100 1,082,800 970,700 865,800 1,917.400 1.760,000 1,455,600 1,134,400 33,800 -25.400 3,000 -315,100 Net Income from Continuing Oper... Total Unusual Items Excluding Goo... Total Unusual Items Normalized EBITDA Tax Rate for Calcs 33,800 -25.400 3,000 -315,100 3,713,600 3.534,700 3,113,200 2,717,600 0 0 0 0 Tax Effect of Unusual Items 6,949 -5,334 780 -57.978 Balance Sheet All numbers in thousands Get access to 40+ years of historical data with Yahoo Finance Premium. Learn more Breakdown 9/30/2019 9/30/2018 9/30/2017 > Total Assets 18,942,800 19,178,300 18,467,200 7.554,500 8,002,000 8,281,700 > Total Liabilities Net Minority Int... > Total Equity Gross Minority Inte... 11,388,300 11,176,300 10,185,500 Total Capitalization 14,281,000 14,209,200 13,488,600 Common Stock Equity 11,053,600 10,857,500 10,086,200 Net Tangible Assets 9,837,000 9,630,100 8,996,400 Working Capital 2,797,400 2.743,900 3,387.700 Invested Capital 14,379,600 14,670,100 14,049,000 Tangible Book Value 9,837,000 9,630,100 8,996,400 Total Debt 3,326,000 3,812,600 3,962,800 Net Debt 1,077,300 1,021,300 689,200 Share issued 249,456 249,456 249,456 Ordinary Shares Number 220,415 219,515 218,346 Treasury Shares Number 29,040 29,940 31,110 Cash Flow All numbers in thousands Get access to 40+ years of historical data with Yahoo Finance Premium. Learn more Breakdown TTM 9/30/2019 9/30/2018 9/30/2017 > Operating Cash Flow 2.979.700 2,969,900 2,541,900 1,567.900 P > Investing Cash Flow -5,008,800 -2.113,400 - 1,630,500 2,332,900 > Financing Cash Flow 3,295,800 -1,370.500 -1,359,800 - 1,971,400 3,963,500 2,248,700 2.791,300 3,273,600 > End Cash Position Income Tax Paid Supplemental Data 323,600 364,600 1,348,800 -2,527.300 -1,989,700 -1,568,400 -1,039,700 Capital Expenditure Issuance of Debt 4,895,700 0 500 2.400 -426,600 Repayment of Debt -428,600 -418,700 -483,900 Free Cash Flow 452,400 980,200 973,500 528,200 Assets 2016 2017 2018 2019 2020 Fiscal year is July June. All values USD millions 3.21B 2.78B 2.178 1.96B 1.918 3.198 Cash & Short Term investments Cash Only Short-Term Investments 2.788 2.17B 1.95B 1.013 23,5M 3.2M 3.3M 10.5M 1.78 2.443 Total Accounts Receivable 1.748 1.988 2448 1.748 1.78 1.988 2443 2448 1.783 1.758 2.04B 2.490 2538 Accounts Receivables, Net Accounts Receivables, Gross Bad Debt Doubtful Accounts Other Receivables 34 1M) (49.6M) (51.3M) (549M) (92.51) Inventories Finished Goods Work in Progress Raw Materials Progress Payments & Other 34 54B 28.17B 27.678 29.943 27 218 Other Current Assets Top 34 548 28.178 27.670 Other Current Assets 29.94B 27 218 Miscellaneous Current Assets 34 548 28.17B 27.678 29 94B 27.218 39 58 32.66B Total Current Assets 31.82B 34 34B 31.568 2016 2017 2018 2019 2020 685M 779.9M Net Property. Plant & Equipment 793.7M 764 2M 1.28 1.848 2.038 2.14B 2.18B Property. Plant & Equipment - Gross 2.725 745.7M 773 1M 791.8M Buildings 781.2M 737.2M Land & Improvements 490. IM 599,6M 637 1. Computer Software and Equipment Other Property, Plant & Equipment Accumulated Depreciation 651.6M 643 6M 1.100 1.250 1.348 1428 1528 7.8M 7,6M 7 2M 261.4M 13.0M Total Investments and Advances 7.BM 70M 7.2M 261.4M 13.6M Other Long-Term investments 27 AM 28M 25.5M 23.8M 18.0M Long Term Note Receivable 2.22B 2.36B 3.13B 3.39B Intangible Assets Net Goodwill 1.683 1.74B 2.24B 2.328 Net Other intangibles 534,2M 620.2M 886.4M 1.07B 1.13B 1.34B 3.07B 3.18 Other Assets Tangible Other Assets 826.7M 1.348 692 1M 673M Total Assets 43.678 37.18B 38.85B 41.89B Liabilities & Shareholders' Equity 2016 2017 2018 2019 2020 54 262M 1.118 262M 1.115 1523M 149.7M 135.4M 125 5M 102M 38 1M 49M 43.5M 54 8M 440.1M ST Dete & Current Portion LT Dett Short Term Debt Current Portion of Long Term Debt Accounts Payable Income Tax Payable Other Current Liabilities Dividends Payable Accrued Payroll Mascellaneous Current Liabilities Total Current Liabilities Long-Term Debt 35.678 29.628 30.23B 32.10B 28.878 238.4M 250.5M 298.9M 840 14 387 3M 616.7M 502.5M 667.7M 7211M 557M 34.81B 20 GB 29.278 31.128 27938 35,858 20.8263 30,413 32.63B 30.138 2.01B 20 2B 28 1.35B Long-Term Debt excl. Capitalized Leases 2018 28 2B 28 13 Non-Convertible Debt 2.018 28 28 2B 18 2018 2B 28 28 1B Non-Convertible Debt Convertible Debt 137 2M 137. IM 132.7M Capitalized Lease Obligations Provision for Risks & Charges Deferred Taxes 142 BM 205.7M 163, M 522M 659 9M 150,8M 731.9M 251 TM 1631M 522M 659.9M Deferred Taxes - Credit 731.9M 100.3M 945M 1.085 1.048 18 1.063 Deferred Taxes. Debit Other Liabilities Other Liabilities (excl. Deferred Income) 583.9M 693.1M 595.3M 655,8M 631,3M 381 M 391.4M 45.1M 389.3M 370 6M Deferred Income 39.198 33.28 34.110 36.49B 33.41B Total Liabilities