| | | | | Indy | Houston | NY | LA |
| Q | Seed | | Conference | MW | SOUTH | EAST | WEST |
| | | | | | | | |
| 5 | 1 | KU | B12 | 488 | 757 | 1131 | 1319 |
| | 1 | Baylor | B12 | 838 | 185 | 1434 | 1417 |
| 1 | 1 | Dayton | A10 | 104 | 937 | 541 | 1910 |
| 4 | 1 | Gonzaga | WCC | 1981 | 2339 | 2581 | 1134 |
| 2 | 2 | Creighton | BEAST | 527 | 795 | 1146 | 1302 |
| | 2 | Florida St. | ACC | 662 | 664 | 1097 | 1996 |
| 3 | 2 | Kentucky | SEC | 149 | 993 | 708 | 1897 |
| | 2 | SDSU | MW | 1787 | 1301 | 2430 | 89 |
| 7 | 3 | Duke | ACC | 474 | 1174 | 421 | 2218 |
| 1 | 3 | MSU | B10 | 223 | 1081 | 558 | 1912 |
| 2 | 3 | Villanova | BEAST | 584 | 1546 | 81 | 2391 |
| | 3 | Seton Hall | BEAST | 631 | 1407 | 13 | 2432 |
| | 4 | Wisconsin | B10 | 284 | 1151 | 808 | 1976 |
| | 4 | Oregon | P12 | 1906 | 1809 | 2916 | 738 |
| | 4 | Maryland | B10 | 495 | 1423 | 196 | 2637 |
| 2 | 4 | Louisville | ACC | 107 | 957 | 650 | 2081 |
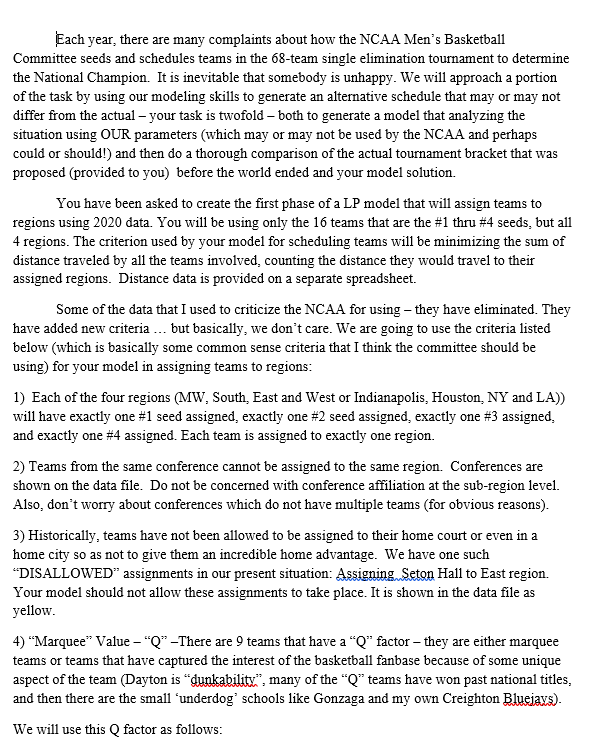
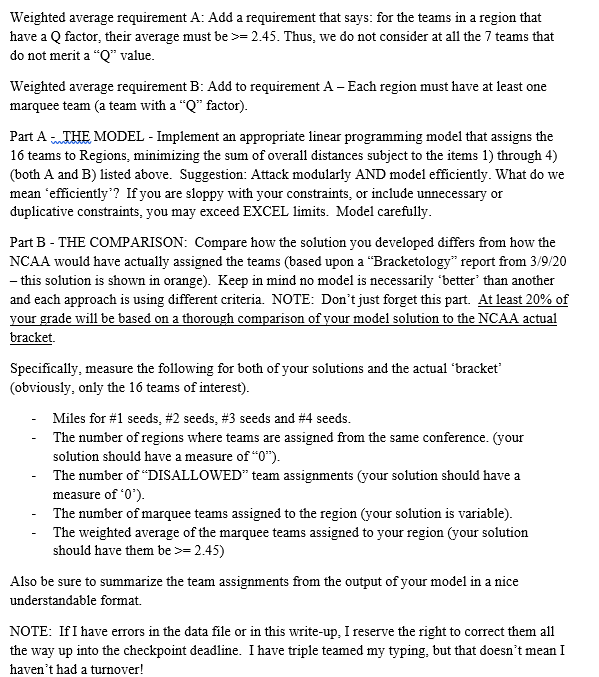
Each year, there are many complaints about how the NCAA Men's Basketball Committee seeds and schedules teams in the 68-team single elimination tournament to determine the National Champion. It is inevitable that somebody is unhappy. We will approach a portion of the task by using our modeling skills to generate an alternative schedule that may or may not differ from the actual your task is twofold both to generate a model that analyzing the situation using OUR parameters (which may or may not be used by the NCAA and perhaps could or should!) and then do a thorough comparison of the actual tournament bracket that was proposed (provided to you) before the world ended and your model solution. You have been asked to create the first phase of a LP model that will assign teams to regions using 2020 data. You will be using only the 16 teams that are the #1 thru #4 seeds, but all 4 regions. The criterion used by your model for scheduling teams will be minimizing the sum of distance traveled by all the teams involved, counting the distance they would travel to their assigned regions. Distance data is provided on a separate spreadsheet. Some of the data that I used to criticize the NCAA for using they have eliminated. They have added new criteria ... but basically, we don't care. We are going to use the criteria listed below (which is basically some common sense criteria that I think the committee should be using) for your model in assigning teams to regions: 1) Each of the four regions (MW, South, East and West or Indianapolis, Houston, NY and LA)) will have exactly one #1 seed assigned, exactly one #2 seed assigned, exactly one #3 assigned and exactly one #4 assigned. Each team is assigned to exactly one region. 2) Teams from the same conference cannot be assigned to the same region. Conferences are shown on the data file. Do not be concerned with conference affiliation at the sub-region level. Also, don't worry about conferences which do not have multiple teams (for obvious reasons). 3) Historically, teams have not been allowed to be assigned to their home court or even in a home city so as not to give them an incredible home advantage. We have one such **DISALLOWED assignments in our present situation: Assigning Seton Hall to East region. Your model should not allow these assignments to take place. It is shown in the data file as yellow. 4) "Marquee" Value - "Q"-There are 9 teams that have a Q factor they are either marquee teams or teams that have captured the interest of the basketball fanbase because of some unique aspect of the team (Dayton is dunkability", many of the "Q" teams have won past national titles, and then there are the small 'underdog' schools like Gonzaga and my own Creighton Bluejays). We will use this Q factor as follows: Weighted average requirement A: Add a requirement that says: for the teams in a region that have a Q factor, their average must be >= 2.45. Thus, we do not consider at all the 7 teams that do not merit a "Q" value. Weighted average requirement B: Add to requirement A - Each region must have at least one marquee team (a team with a "Q" factor). Part A - THE MODEL - Implement an appropriate linear programming model that assigns the 16 teams to Regions, minimizing the sum of overall distances subject to the items 1) through 4) (both A and B) listed above. Suggestion: Attack modularly AND model efficiently. What do we mean 'efficiently? If you are sloppy with your constraints, or include unnecessary or duplicative constraints, you may exceed EXCEL limits. Model carefully. Part B - THE COMPARISON: Compare how the solution you developed differs from how the NCAA would have actually assigned the teams (based upon a "Bracketology report from 3/9/20 - this solution is shown in orange). Keep in mind no model is necessarily better than another and each approach is using different criteria. NOTE: Don't just forget this part. At least 20% of your grade will be based on a thorough comparison of your model solution to the NCAA actual bracket Specifically, measure the following for both of your solutions and the actual bracket (obviously, only the 16 teams of interest). Miles for #1 seeds. #2 seeds, #3 seeds and #4 seeds. The number of regions where teams are assigned from the same conference. (your solution should have a measure of "0"). The number of DISALLOWED" team assignments (your solution should have a measure of '0'). The number of marquee teams assigned to the region (your solution is variable). The weighted average of the marquee teams assigned to your region (your solution should have them be >= 2.45) Also be sure to summarize the team assignments from the output of your model in a nice understandable format NOTE: If I have errors in the data file or in this write-up. I reserve the right to correct them all the way up into the checkpoint deadline. I have triple teamed my typing, but that doesn't mean I haven't had a turnover! Each year, there are many complaints about how the NCAA Men's Basketball Committee seeds and schedules teams in the 68-team single elimination tournament to determine the National Champion. It is inevitable that somebody is unhappy. We will approach a portion of the task by using our modeling skills to generate an alternative schedule that may or may not differ from the actual your task is twofold both to generate a model that analyzing the situation using OUR parameters (which may or may not be used by the NCAA and perhaps could or should!) and then do a thorough comparison of the actual tournament bracket that was proposed (provided to you) before the world ended and your model solution. You have been asked to create the first phase of a LP model that will assign teams to regions using 2020 data. You will be using only the 16 teams that are the #1 thru #4 seeds, but all 4 regions. The criterion used by your model for scheduling teams will be minimizing the sum of distance traveled by all the teams involved, counting the distance they would travel to their assigned regions. Distance data is provided on a separate spreadsheet. Some of the data that I used to criticize the NCAA for using they have eliminated. They have added new criteria ... but basically, we don't care. We are going to use the criteria listed below (which is basically some common sense criteria that I think the committee should be using) for your model in assigning teams to regions: 1) Each of the four regions (MW, South, East and West or Indianapolis, Houston, NY and LA)) will have exactly one #1 seed assigned, exactly one #2 seed assigned, exactly one #3 assigned and exactly one #4 assigned. Each team is assigned to exactly one region. 2) Teams from the same conference cannot be assigned to the same region. Conferences are shown on the data file. Do not be concerned with conference affiliation at the sub-region level. Also, don't worry about conferences which do not have multiple teams (for obvious reasons). 3) Historically, teams have not been allowed to be assigned to their home court or even in a home city so as not to give them an incredible home advantage. We have one such **DISALLOWED assignments in our present situation: Assigning Seton Hall to East region. Your model should not allow these assignments to take place. It is shown in the data file as yellow. 4) "Marquee" Value - "Q"-There are 9 teams that have a Q factor they are either marquee teams or teams that have captured the interest of the basketball fanbase because of some unique aspect of the team (Dayton is dunkability", many of the "Q" teams have won past national titles, and then there are the small 'underdog' schools like Gonzaga and my own Creighton Bluejays). We will use this Q factor as follows: Weighted average requirement A: Add a requirement that says: for the teams in a region that have a Q factor, their average must be >= 2.45. Thus, we do not consider at all the 7 teams that do not merit a "Q" value. Weighted average requirement B: Add to requirement A - Each region must have at least one marquee team (a team with a "Q" factor). Part A - THE MODEL - Implement an appropriate linear programming model that assigns the 16 teams to Regions, minimizing the sum of overall distances subject to the items 1) through 4) (both A and B) listed above. Suggestion: Attack modularly AND model efficiently. What do we mean 'efficiently? If you are sloppy with your constraints, or include unnecessary or duplicative constraints, you may exceed EXCEL limits. Model carefully. Part B - THE COMPARISON: Compare how the solution you developed differs from how the NCAA would have actually assigned the teams (based upon a "Bracketology report from 3/9/20 - this solution is shown in orange). Keep in mind no model is necessarily better than another and each approach is using different criteria. NOTE: Don't just forget this part. At least 20% of your grade will be based on a thorough comparison of your model solution to the NCAA actual bracket Specifically, measure the following for both of your solutions and the actual bracket (obviously, only the 16 teams of interest). Miles for #1 seeds. #2 seeds, #3 seeds and #4 seeds. The number of regions where teams are assigned from the same conference. (your solution should have a measure of "0"). The number of DISALLOWED" team assignments (your solution should have a measure of '0'). The number of marquee teams assigned to the region (your solution is variable). The weighted average of the marquee teams assigned to your region (your solution should have them be >= 2.45) Also be sure to summarize the team assignments from the output of your model in a nice understandable format NOTE: If I have errors in the data file or in this write-up. I reserve the right to correct them all the way up into the checkpoint deadline. I have triple teamed my typing, but that doesn't mean I haven't had a turnover