

Answered step by step
Verified Expert Solution
Question
1 Approved Answer
Inferences and Conclusions from Data Project Part I. Mrs. Pugh recorded all of the semester grades (on a scale of 100) of her 45
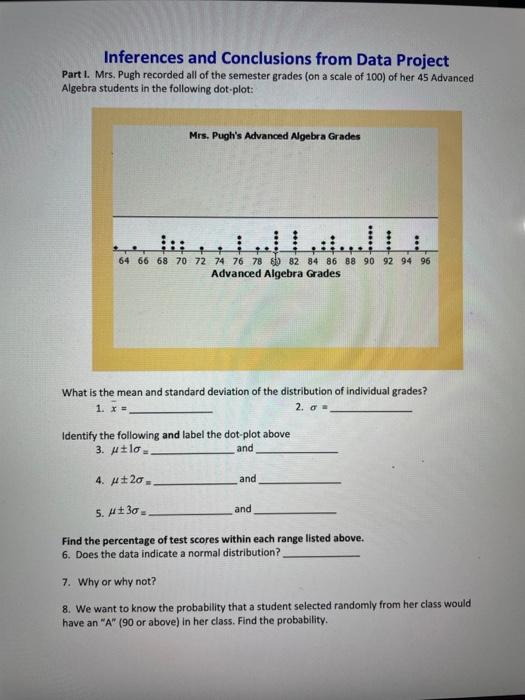
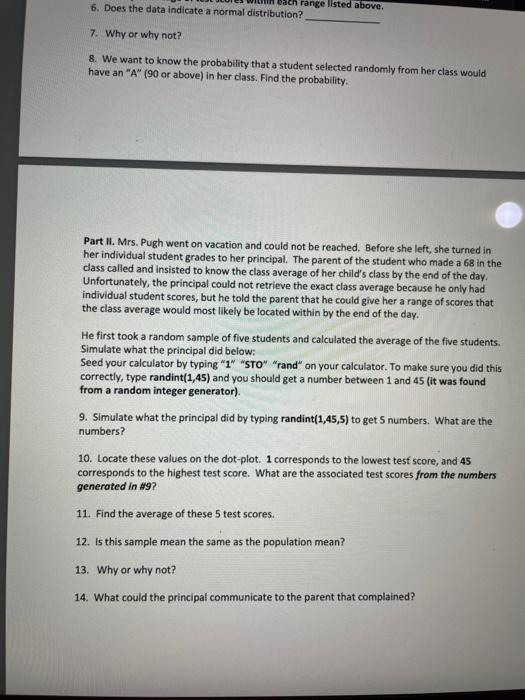
Inferences and Conclusions from Data Project Part I. Mrs. Pugh recorded all of the semester grades (on a scale of 100) of her 45 Advanced Algebra students in the following dot-plot: Mrs. Pugh's Advanced Algebra Grades 64 66 68 70 72 74 76 78 82 84 86 88 90 92 94 96 Advanced Algebra Grades What is the mean and standard deviation of the distribution of individual grades? 2. Identify the following and label the dot-plot above 3. lo_ and 4. 20. 5. 30. Find the percentage of test scores within each range listed above. 6. Does the data indicate a normal distribution?. 7. Why or why not? 8. We want to know the probability that a student selected randomly from her class would have an "A" (90 or above) in her class. Find the probability. and and range listed above. 6. Does the data indicate a normal distribution? 7. Why or why not? 8. We want to know the probability that a student selected randomly from her class would have an "A" (90 or above) in her class. Find the probability. Part II. Mrs. Pugh went on vacation and could not be reached. Before she left, she turned in her individual student grades to her principal. The parent of the student who made a 68 in the class called and insisted to know the class average of her child's class by the end of the day. Unfortunately, the principal could not retrieve the exact class average because he only had individual student scores, but he told the parent that he could give her a range of scores that the class average would most likely be located within by the end of the day. He first took a random sample of five students and calculated the average of the five students. Simulate what the principal did below: Seed your calculator by typing "1" "STO" "rand" on your calculator. To make sure you did this correctly, type randint(1,45) and you should get a number between 1 and 45 (it was found from a random integer generator). 9. Simulate what the principal did by typing randint(1,45,5) to get 5 numbers. What are the numbers? 10. Locate these values on the dot-plot. 1 corresponds to the lowest test score, and 45 corresponds to the highest test score. What are the associated test scores from the numbers generated in #19? 11. Find the average of these 5 test scores. 12. Is this sample mean the same as the population mean? 13. Why or why not? 14. What could the principal communicate to the parent that complained?
Step by Step Solution
There are 3 Steps involved in it
Step: 1
The images youve provided show a worksheet titled Inferences and Conclusions from Data Project with a dot plot graph of Mrs Pughs Advanced Algebra Grades It also includes a number of questions based o...
Get Instant Access to Expert-Tailored Solutions
See step-by-step solutions with expert insights and AI powered tools for academic success
Step: 2

Step: 3
Ace Your Homework with AI
Get the answers you need in no time with our AI-driven, step-by-step assistance
Get Started
Intermediate Accounting
Authors: Elizabeth A. Gordon, Jana S. Raedy, Alexander J. Sannella
2nd edition
134730372, 134730370, 978-0134730370