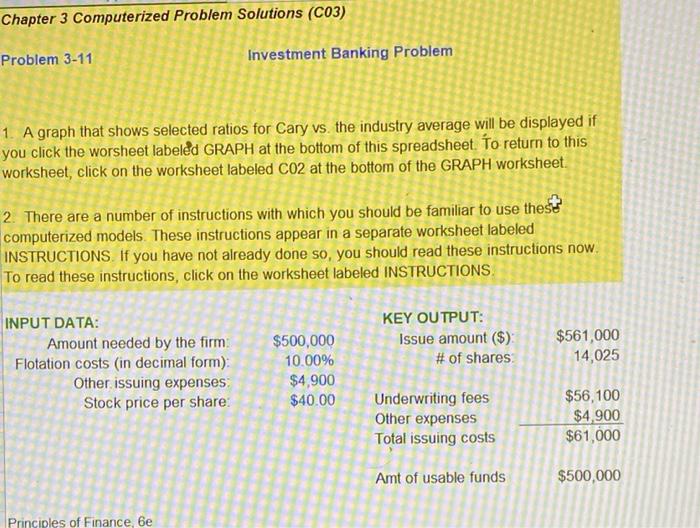
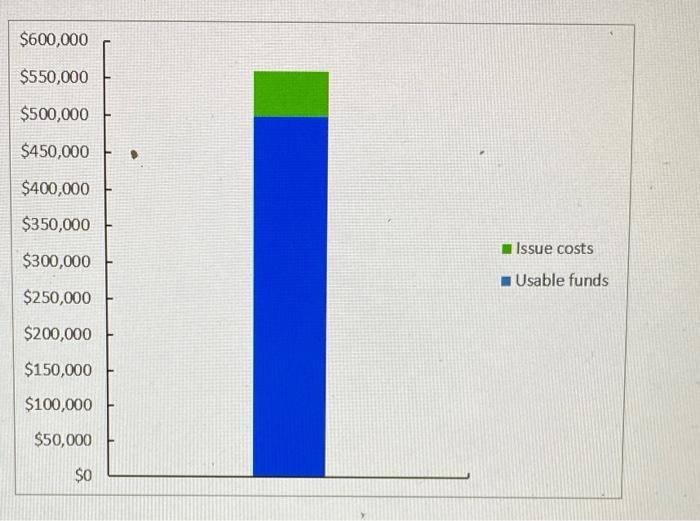
1. A graph that shows selected ratios for Cary vs. the industry average will be displayed if you click the worsheet labeled GRAPH at the bottom of this spreadsheet. To return to this worksheet, click on the worksheet labeled CO2 at the bottom of the GRAPH worksheet. 2. There are a number of instructions with which you should be familiar to use these computerized models. These instructions appear in a separate worksheet labeled INSTRUCTIONS. If you have not already done so, you should read these instructions now. To read these instructions, click on the worksheet labeled INSTRUCTIONS, Ne have already entered the base case data for each model in this ile, and the models have performed the analysis for preceding parts of the problem. You will need to enter the data for each of the remaining parts of the problem -we indicate in each problem the parts which should be done using the computerized diskette. However, there are several points worth noting before you go into a model: 1. The input data are entered in specified cells in the INPUT DATA section. When you change an input item, the model automatically recalculates the values of appropriate output data items, unless you are told otherwise. Sometimes you will be told to press two keys to update the model. 2. The key output data are displayed to the right of the INPUT DATA section or immediately below it. This placement permits you to change an input and instantly see how that change affects the output of the model. This is extremely useful in sensitivity analysis. 3. Input data items which you may change are distinguished from the ones you should not change. On a color monitor the items which you may change generally appear blue, with the words and numbers in the other cells being black. 4. All percentages must be entered as decimals. Dollars and other numbers must be entered without dollar signs or commas. 4. All percentages must be entered as decimals. Dollars and other numbers must be entered without dollar signs or commas. 5. Instructions and comments concerning specific models accompany each model. To invoke model graphs, simply click on the worksheet labeled GRAPH, which is located at the bottom of the main spreadsheet. 1. A graph that shows selected ratios for Cary vs. the industry average will be displayed if you click the worsheet labeled GRAPH at the bottom of this spreadsheet. To return to this worksheet, click on the worksheet labeled CO2 at the bottom of the GRAPH worksheet. 2. There are a number of instructions with which you should be familiar to use these computerized models. These instructions appear in a separate worksheet labeled INSTRUCTIONS. If you have not already done so, you should read these instructions now. To read these instructions, click on the worksheet labeled INSTRUCTIONS, Ne have already entered the base case data for each model in this ile, and the models have performed the analysis for preceding parts of the problem. You will need to enter the data for each of the remaining parts of the problem -we indicate in each problem the parts which should be done using the computerized diskette. However, there are several points worth noting before you go into a model: 1. The input data are entered in specified cells in the INPUT DATA section. When you change an input item, the model automatically recalculates the values of appropriate output data items, unless you are told otherwise. Sometimes you will be told to press two keys to update the model. 2. The key output data are displayed to the right of the INPUT DATA section or immediately below it. This placement permits you to change an input and instantly see how that change affects the output of the model. This is extremely useful in sensitivity analysis. 3. Input data items which you may change are distinguished from the ones you should not change. On a color monitor the items which you may change generally appear blue, with the words and numbers in the other cells being black. 4. All percentages must be entered as decimals. Dollars and other numbers must be entered without dollar signs or commas. 4. All percentages must be entered as decimals. Dollars and other numbers must be entered without dollar signs or commas. 5. Instructions and comments concerning specific models accompany each model. To invoke model graphs, simply click on the worksheet labeled GRAPH, which is located at the bottom of the main spreadsheet