

Question: Access the Call Center Waiting Time file. Each row in the database corresponds to a different call. The column variables are as follows: ProtocolType;
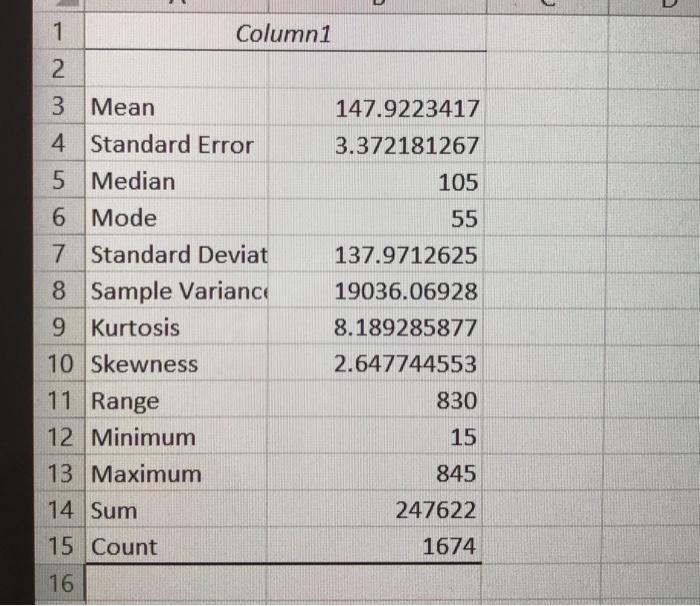
Access the Call Center Waiting Time file. Each row in the database corresponds to a different call. The column variables are as follows: ProtocolType; indicates protocol type, either PT or PE QueueTime; Time in Queue, in seconds ServiceTime: Service Time, in seconds Perform a test of hypothesis to determine whether the average TIQ is lower than the industry standard of 2.5 minutes (150 seconds). Use a significance level of a=0.05. Evaluate if the company should allocate more resources to improve its average TIQ. 1 Column1 3 Mean 147.9223417 4 Standard Error 3.372181267 5 Median 105 6. 6 Mode 55 7 Standard Deviat 137.9712625 8 Sample Variance 9 Kurtosis 19036.06928 8.189285877 10 Skewness 2.647744553 11 Range 12 Minimum 13 aximum 830 15 845 14 Sum 247622 15 Count 1674 16
Step by Step Solution
3.31 Rating (151 Votes )
There are 3 Steps involved in it

Get step-by-step solutions from verified subject matter experts