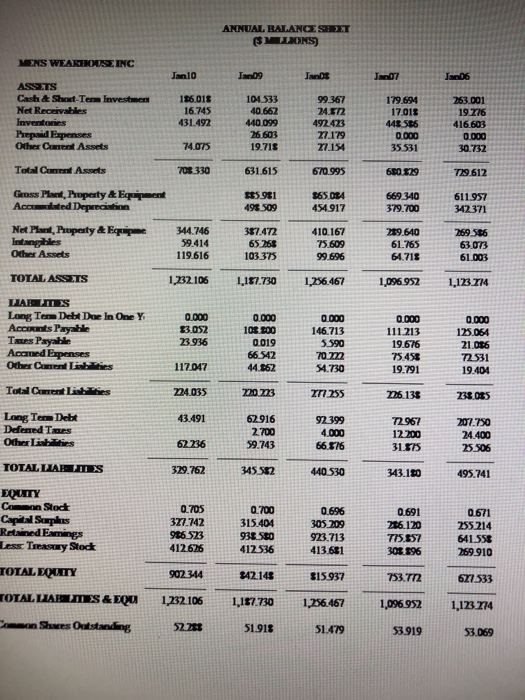
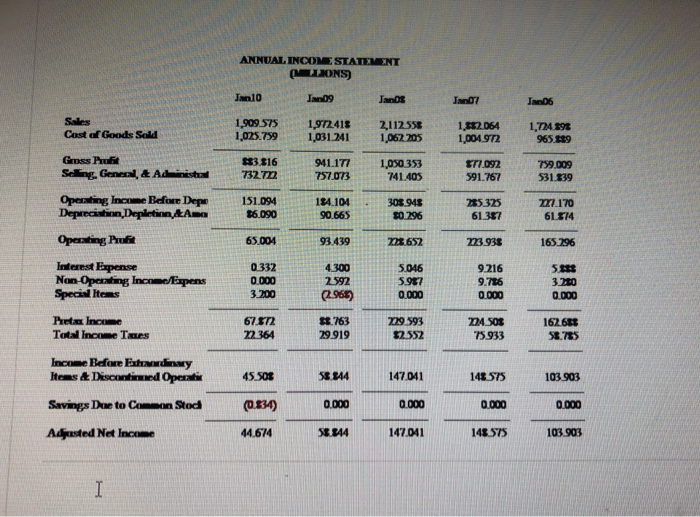
Instructions: Analyze the attached Balance Sheet and Income statement, calculating and interpreting the following ratios, and making a conclusion on the financial position of the company addressing the financial category.
Turnover-Control Ratios; Asset turnover, Fixed-asset turnover, Inventory turnover, Collection period (days), Days' sales in cash, Payables period
Show your work


ANNUAL BALANCE STRET SILLIONS) MENS WEARHOUSE INC Jan 10 Jang Jandt Jan 07 JaD6 ASSETS Cash & Shut-Ten Invest Not Receivables Inventories Prepaid Expenses Other Cuent Assets 186,01$ 16.745 431.492 104.533 40 662 440.099 26 603 19.718 99.367 24.502 492.423 27.179 27.154 179.694 17.013 448 506 0.000 35 531 263.001 19.276 416.603 0.000 30.732 74 075 Total Can Asts 703 330 631.615 670.995 680.529 729.612 Geoss Planet, Property & Equipment Accuated Depreciation $5.981 498 509 165 DBA 454.917 669 340 379.700 611.957 342371 Net and Property & Equipe Intangibles Other Assets 344.746 59.414 119.616 357.472 65 266 103375 410.167 75.609 99.696 209.640 61.765 61.718 269.56 63.073 61.003 TOTAL ASSETS 1.232.106 1,157.730 1,256.467 1,096.952 1,123.714 LIAMS Long Term Debt Dee In One Y. Accents Payable Taxes Payable Acomed Expenses Other Can Lisbites 0.000 33.052 23.936 0.000 100.000 0.019 66942 44.162 0.000 146.713 5.390 70 m 54.730 0.000 111.213 19.676 75.450 19.791 0.000 125.064 21.066 72531 19.404 117047 Total Cement Listes 224.035 220723 277255 276.13 238 005 43.491 Lang Tea Debt Defensed Taxes Other listes 62 916 2.700 59.743 92 399 4.000 66.576 72.967 12200 31.575 207.750 24.400 25.506 62 236 TOTAL DIAMS 329.762 345 582 440 530 343.100 495.741 EQUITY Con Stod Capital Surplus Retained Exmings Less Treasury Stock TOTAL EQUITY TOTAL LIABLES & EQUI 0.705 327.742 916523 412.626 0.700 315.404 930580 412.536 0.696 305 209 923.713 413.681 0.691 216.120 775.657 300 596 0.671 255 214 641538 269910 902344 842.148 $15.937 753.772 677533 1,232.106 1,187.730 1.256.467 1,096,952 1,12314 Can Shues standing 52 253 51.918 51.479 53919 53.069 ANNUAL INCOME STATEMENT (LLIONS) Jano Jan09 Jang Jan 07 JanD6 Sales Cast of Goods Sold 1,909.575 1,025.759 1,972.418 1,031.241 2,112558 1,062 205 1.562054 1,004.972 1,724 898 965.829 Gross Profit Seng General & Ada niste $33.816 732.72 941.177 757,073 1,030 333 741.405 $17.092 591.767 799.009 531.339 Operating Income Before Depe Depreciation Depletion &Ama 151.094 $6.090 184.104 90.665 300 945 30 296 285325 61.387 27.170 61.574 Operating Profit 65.004 93.439 m2 652 7.938 165 296 Interest Expense Non Operating Income Expens Special Items 0332 0.000 3.200 4.300 2592 (2.965) 5046 5.987 0.000 9.216 9.786 0.000 5.30 3.200 0.000 Piet Income Total Income Taxes 67.572 72 364 $8.763 29.919 719 593 12552 m4.sos 75933 162685 88.785 Income Before Exhday Items & Discontinued Operati 45.50 58.844 147.041 148575 103 903 Savings Due to Common Stod (0.334) 0.000 0.000 0.000 0.000 Adrested Net Income 44.674 30.844 147.041 148.575 103 903 I ANNUAL BALANCE STRET SILLIONS) MENS WEARHOUSE INC Jan 10 Jang Jandt Jan 07 JaD6 ASSETS Cash & Shut-Ten Invest Not Receivables Inventories Prepaid Expenses Other Cuent Assets 186,01$ 16.745 431.492 104.533 40 662 440.099 26 603 19.718 99.367 24.502 492.423 27.179 27.154 179.694 17.013 448 506 0.000 35 531 263.001 19.276 416.603 0.000 30.732 74 075 Total Can Asts 703 330 631.615 670.995 680.529 729.612 Geoss Planet, Property & Equipment Accuated Depreciation $5.981 498 509 165 DBA 454.917 669 340 379.700 611.957 342371 Net and Property & Equipe Intangibles Other Assets 344.746 59.414 119.616 357.472 65 266 103375 410.167 75.609 99.696 209.640 61.765 61.718 269.56 63.073 61.003 TOTAL ASSETS 1.232.106 1,157.730 1,256.467 1,096.952 1,123.714 LIAMS Long Term Debt Dee In One Y. Accents Payable Taxes Payable Acomed Expenses Other Can Lisbites 0.000 33.052 23.936 0.000 100.000 0.019 66942 44.162 0.000 146.713 5.390 70 m 54.730 0.000 111.213 19.676 75.450 19.791 0.000 125.064 21.066 72531 19.404 117047 Total Cement Listes 224.035 220723 277255 276.13 238 005 43.491 Lang Tea Debt Defensed Taxes Other listes 62 916 2.700 59.743 92 399 4.000 66.576 72.967 12200 31.575 207.750 24.400 25.506 62 236 TOTAL DIAMS 329.762 345 582 440 530 343.100 495.741 EQUITY Con Stod Capital Surplus Retained Exmings Less Treasury Stock TOTAL EQUITY TOTAL LIABLES & EQUI 0.705 327.742 916523 412.626 0.700 315.404 930580 412.536 0.696 305 209 923.713 413.681 0.691 216.120 775.657 300 596 0.671 255 214 641538 269910 902344 842.148 $15.937 753.772 677533 1,232.106 1,187.730 1.256.467 1,096,952 1,12314 Can Shues standing 52 253 51.918 51.479 53919 53.069 ANNUAL INCOME STATEMENT (LLIONS) Jano Jan09 Jang Jan 07 JanD6 Sales Cast of Goods Sold 1,909.575 1,025.759 1,972.418 1,031.241 2,112558 1,062 205 1.562054 1,004.972 1,724 898 965.829 Gross Profit Seng General & Ada niste $33.816 732.72 941.177 757,073 1,030 333 741.405 $17.092 591.767 799.009 531.339 Operating Income Before Depe Depreciation Depletion &Ama 151.094 $6.090 184.104 90.665 300 945 30 296 285325 61.387 27.170 61.574 Operating Profit 65.004 93.439 m2 652 7.938 165 296 Interest Expense Non Operating Income Expens Special Items 0332 0.000 3.200 4.300 2592 (2.965) 5046 5.987 0.000 9.216 9.786 0.000 5.30 3.200 0.000 Piet Income Total Income Taxes 67.572 72 364 $8.763 29.919 719 593 12552 m4.sos 75933 162685 88.785 Income Before Exhday Items & Discontinued Operati 45.50 58.844 147.041 148575 103 903 Savings Due to Common Stod (0.334) 0.000 0.000 0.000 0.000 Adrested Net Income 44.674 30.844 147.041 148.575 103 903


