Instructions: Answer each question as fully and correctly as possible. Show all intermediate work and calculations. Please CIRCLE) intermediate (non-final, eg a mean when calculating
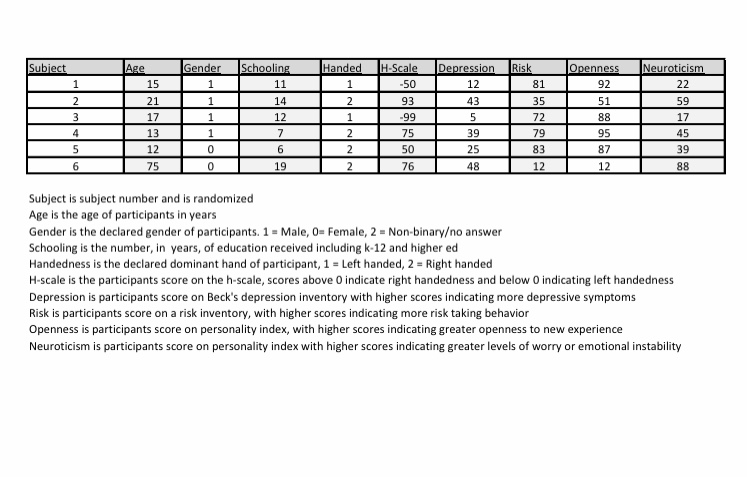
Instructions: Answer each question as fully and correctly as possible. Show all intermediate work and calculations. Please CIRCLE) intermediate (non-final, eg a mean when calculating SD) answers and place a SQUARE around final numerical answers. Please be clear and concise in written answers. You are NOT permitted to use software to calculate any answers but may use graphical software (eg photshop) to create graphs/charts/tables if desired. Due Monday at beginning of class. Please bring finished test to class stapled if multiple pages (and put your name on each page). I will be available via email to answer questions. Take Home Exam 1: 1) Calculate the following scores for each variable for which it is possible and makes sense to calculate the scores. a. Mean b. Median C. Mode d. Range e. Variance f. Standard Deviation 2) Using the above calculations, answer the following questions, provide evidence and show supporting information: a. Which data set is most likely to be skewed? b. Which variable has the highest amount of spread away from the mean? c. The lowest amount of spread from the mean? d. Why does it not necessarily make sense to compare spread directly as in question 'c'? EC: offer a solution to this problem 3) Graph using the ideal type of chart be sure to format and label the chart correctly: a. Comparing Gender and Schooling b. Comparing H-Scale and Depression 4) I want to use a sneaky sample to help change my data, I would like it to appear as though the subjects of my study are less depressed than they really are. Based on the current data and variables, what demographic (or category) of person do you think I should choose to best bias my sample? Explain why using a graph or graphs if necessary. EC: When I was in grad school, myself and a few other graduate students (who shall remain anonymous) had a "late-night sing-along playlist" on spotify for after we had a few "sodas". List two songs you think were on that play list. Bonus points if you're right.Instructions: Answer each question as fully and correctly as possible. Show all intermediate work and calculations. Please CIRCLE) intermediate (non-final, eg a mean when calculating SD) answers and place a SQUARE around final numerical answers. Please be clear and concise in written answers. You are NOT permitted to use software to calculate any answers but may use graphical software (eg photshop) to create graphs/charts/tables if desired. Due Monday at beginning of class. Please bring finished test to class stapled if multiple pages (and put your name on each page). I will be available via email to answer questions. Take Home Exam 1: 1) Calculate the following scores for each variable for which it is possible and makes sense to calculate the scores. a. Mean b. Median C. Mode d. Range e. Variance f. Standard Deviation 2) Using the above calculations, answer the following questions, provide evidence and show supporting information: a. Which data set is most likely to be skewed? b. Which variable has the highest amount of spread away from the mean? c. The lowest amount of spread from the mean? d. Why does it not necessarily make sense to compare spread directly as in question 'c'? EC: offer a solution to this problem 3) Graph using the ideal type of chart be sure to format and label the chart correctly: a. Comparing Gender and Schooling b. Comparing H-Scale and Depression 4) I want to use a sneaky sample to help change my data, I would like it to appear as though the subjects of my study are less depressed than they really are. Based on the current data and variables, what demographic (or category) of person do you think I should choose to best bias my sample? Explain why using a graph or graphs if necessary. EC: When I was in grad school, myself and a few other graduate students (who shall remain anonymous) had a "late-night sing-along playlist" on spotify for after we had a few "sodas". List two songs you think were on that play list. Bonus points if you're right.Subject Neuroticism 22 59 17 45 39 8 8 Age is the age of participants in years Gender is the declared gender of participants. 1 = Male, 0= Female, 2 = Non-binaryo answer Schooling is the number, in years, of education received including k-12 and higher ed Handedness is the declared dominant hand of participant, 1 = Left handed, 2 = Right handed H-scale is the participants score on the h-scale, scores above 0 indicate right handedness and below 0 indicating left handedness Depression is participants score on Beck's depression inventory with higher scores indicating more depressive symptoms Risk is participants score on a risk inventory, with higher scores indicating more risk taking behavior Openness is participants score on personality index, with higher scores indicating greater openness to new experience Neuroticism is participants score on personality index with higher scores indicating greater levels of worry or emotional instabilitySubject Neuroticism 22 59 17 45 39 8 8 Age is the age of participants in years Gender is the declared gender of participants. 1 = Male, 0= Female, 2 = Non-binaryo answer Schooling is the number, in years, of education received including k-12 and higher ed Handedness is the declared dominant hand of participant, 1 = Left handed, 2 = Right handed H-scale is the participants score on the h-scale, scores above 0 indicate right handedness and below 0 indicating left handedness Depression is participants score on Beck's depression inventory with higher scores indicating more depressive symptoms Risk is participants score on a risk inventory, with higher scores indicating more risk taking behavior Openness is participants score on personality index, with higher scores indicating greater openness to new experience Neuroticism is participants score on personality index with higher scores indicating greater levels of worry or emotional instability
Step by Step Solution
There are 3 Steps involved in it
Step: 1
Get Instant Access to Expert-Tailored Solutions
See step-by-step solutions with expert insights and AI powered tools for academic success
Step: 2
Step: 3
Ace Your Homework with AI
Get the answers you need in no time with our AI-driven, step-by-step assistance