Instructions: Complete the quiz in Canvas by answering the questions from the worksheet using the information provided for each scenario in Tables 1-2. You will
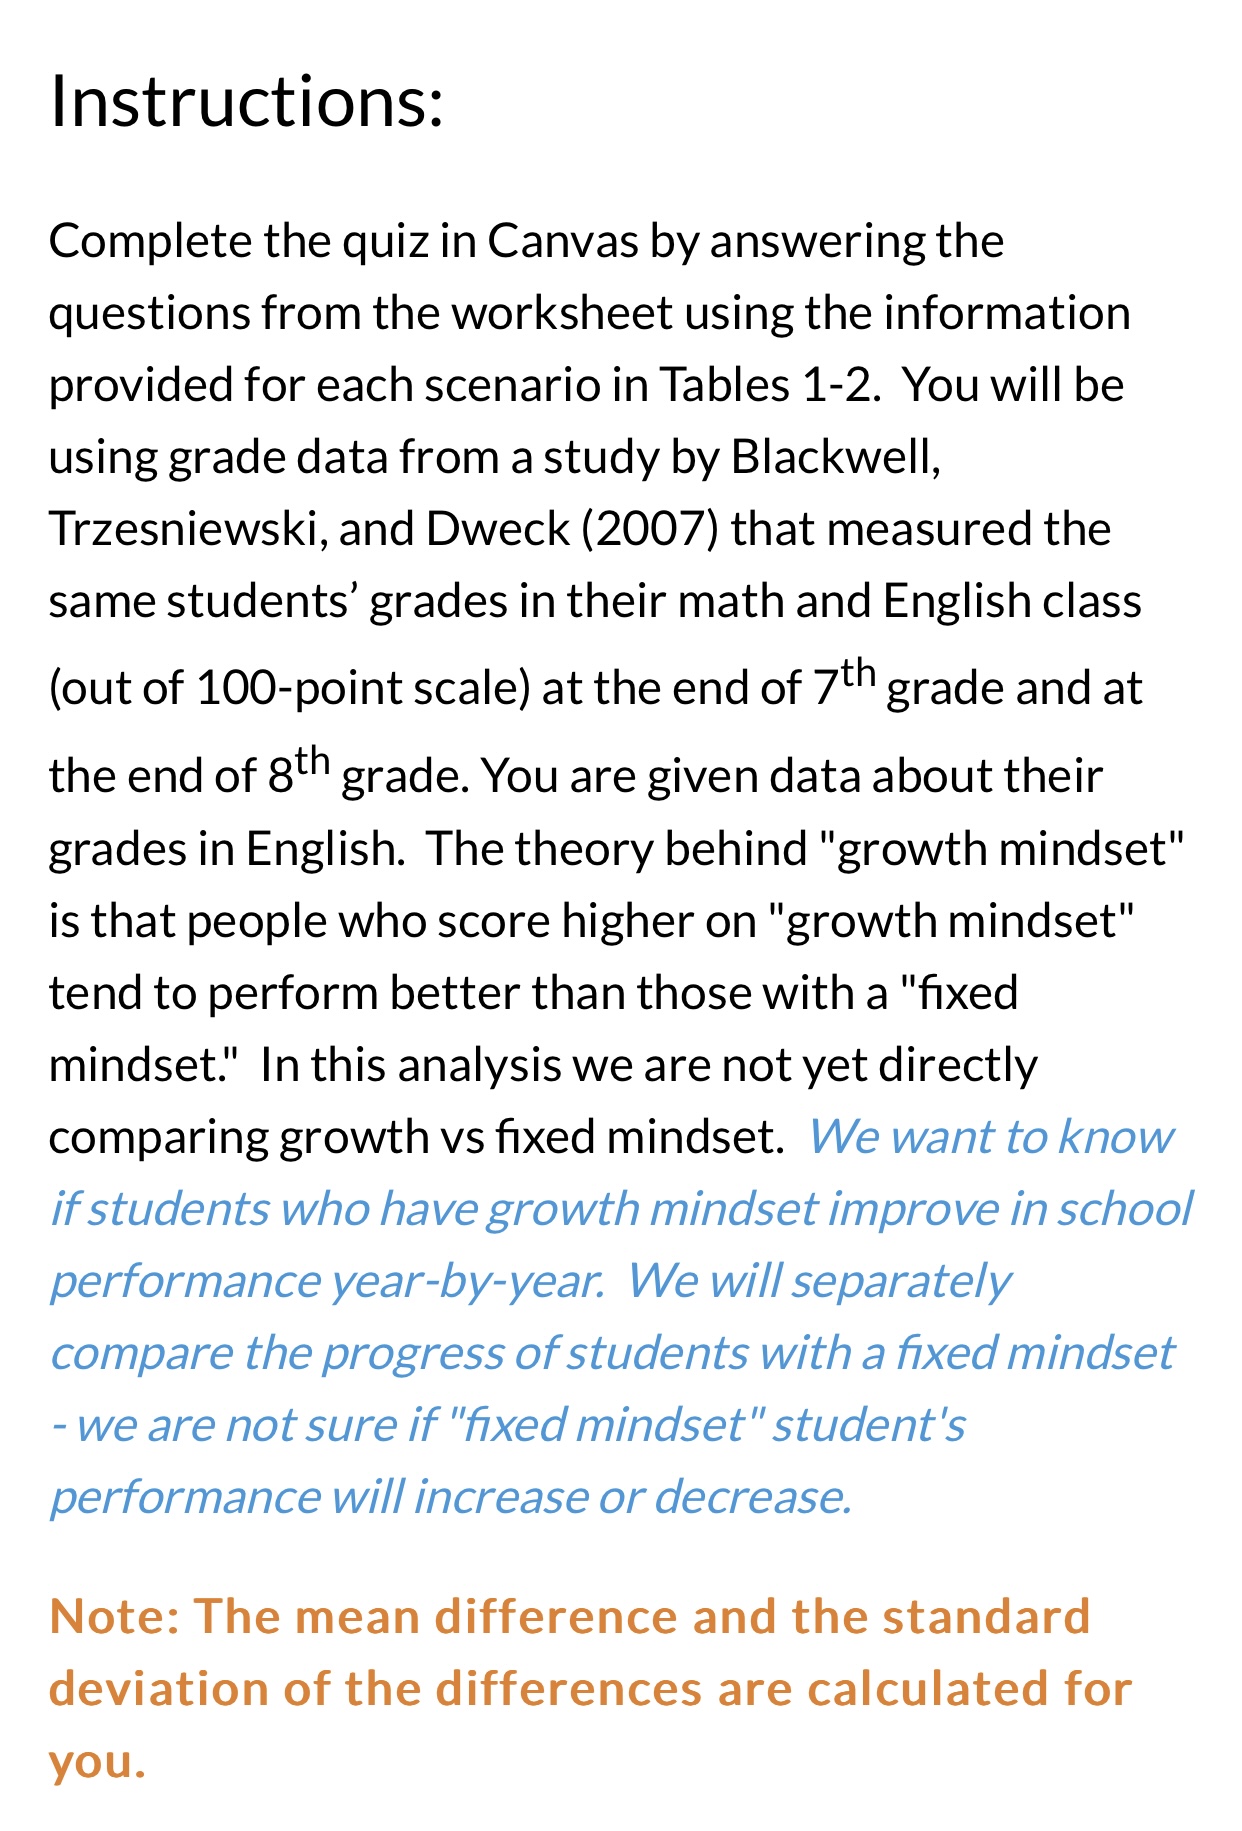
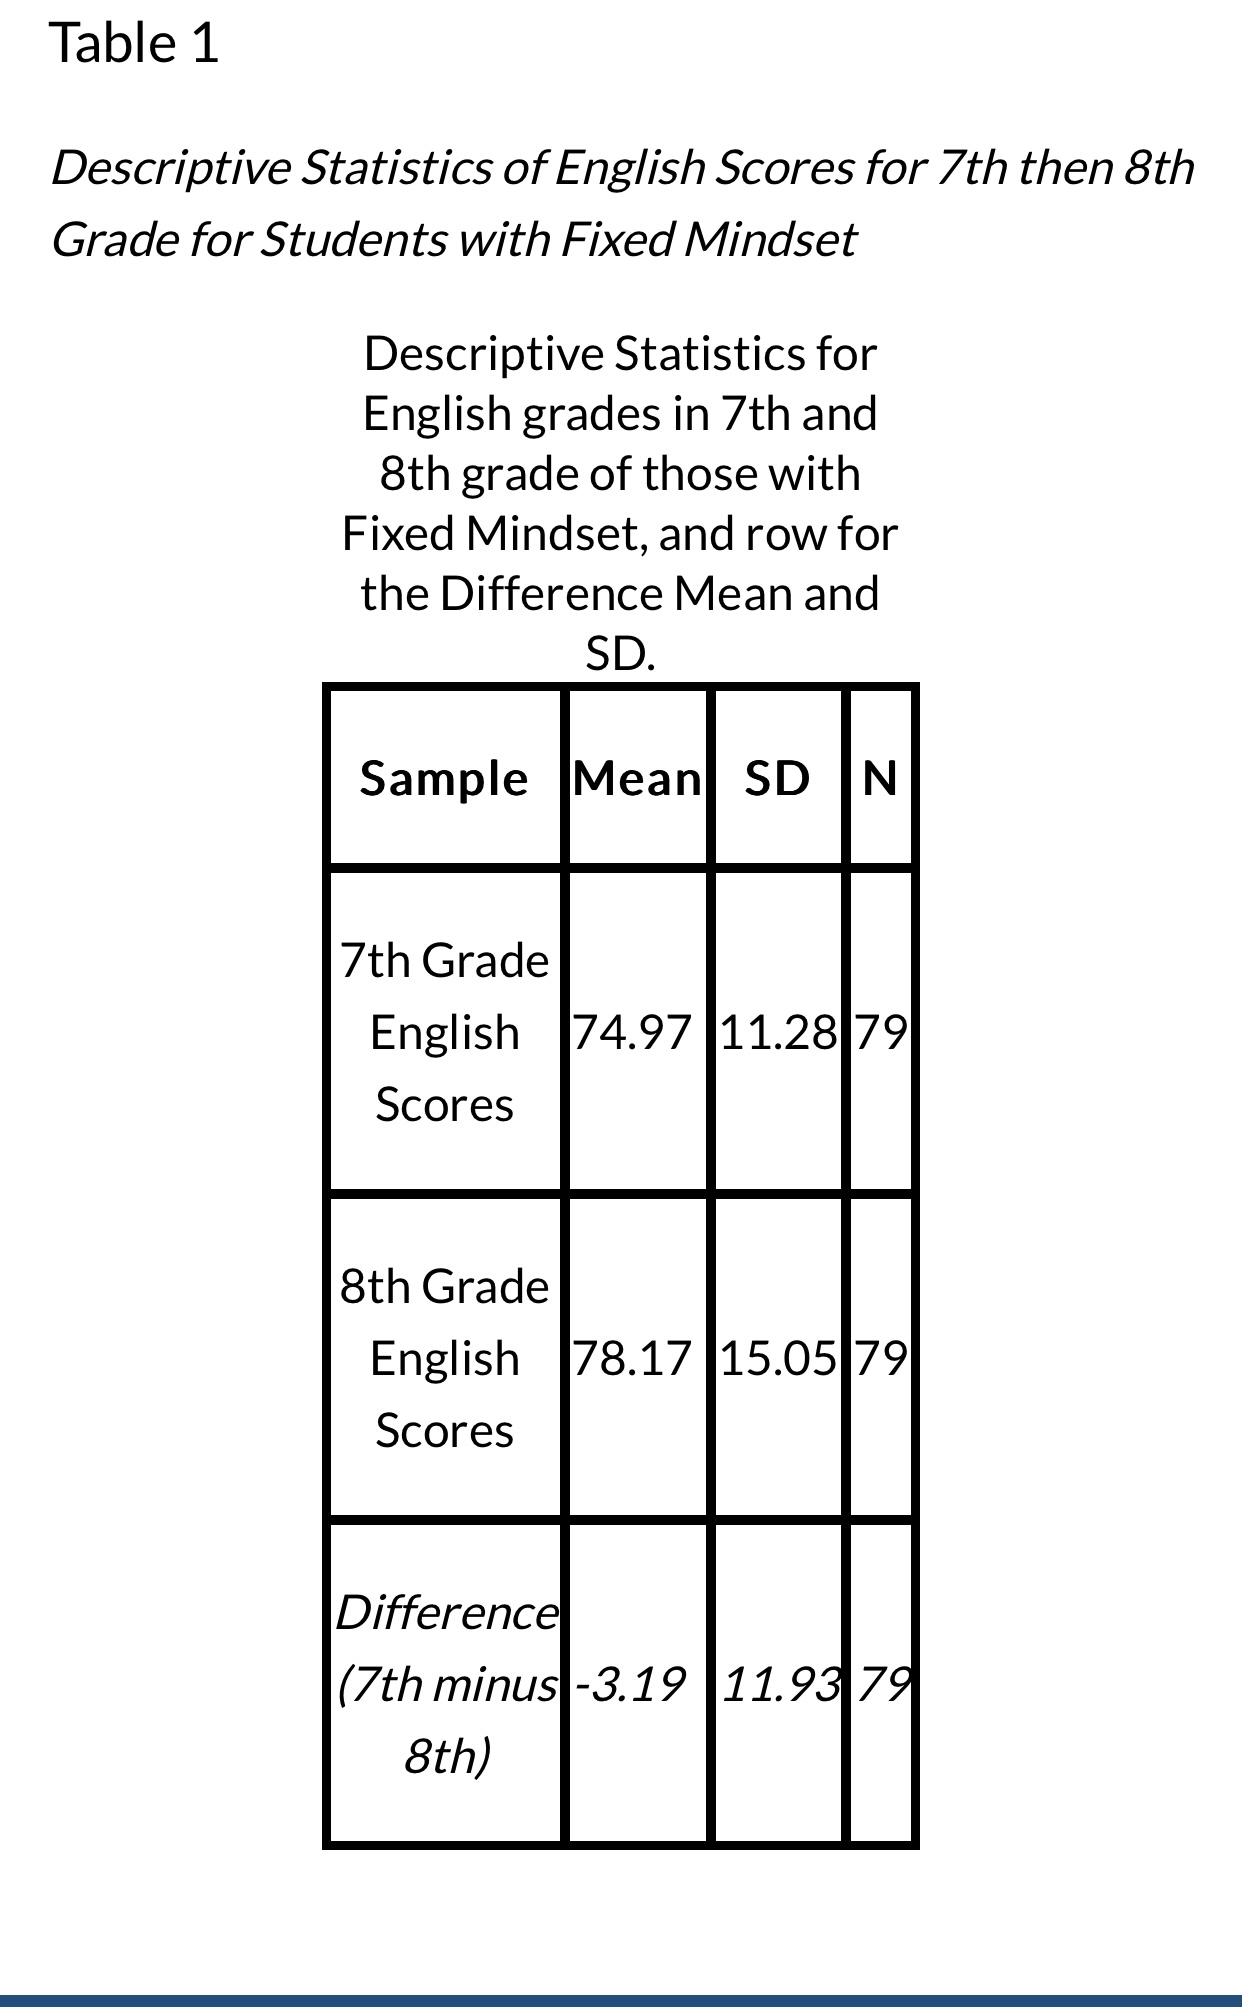
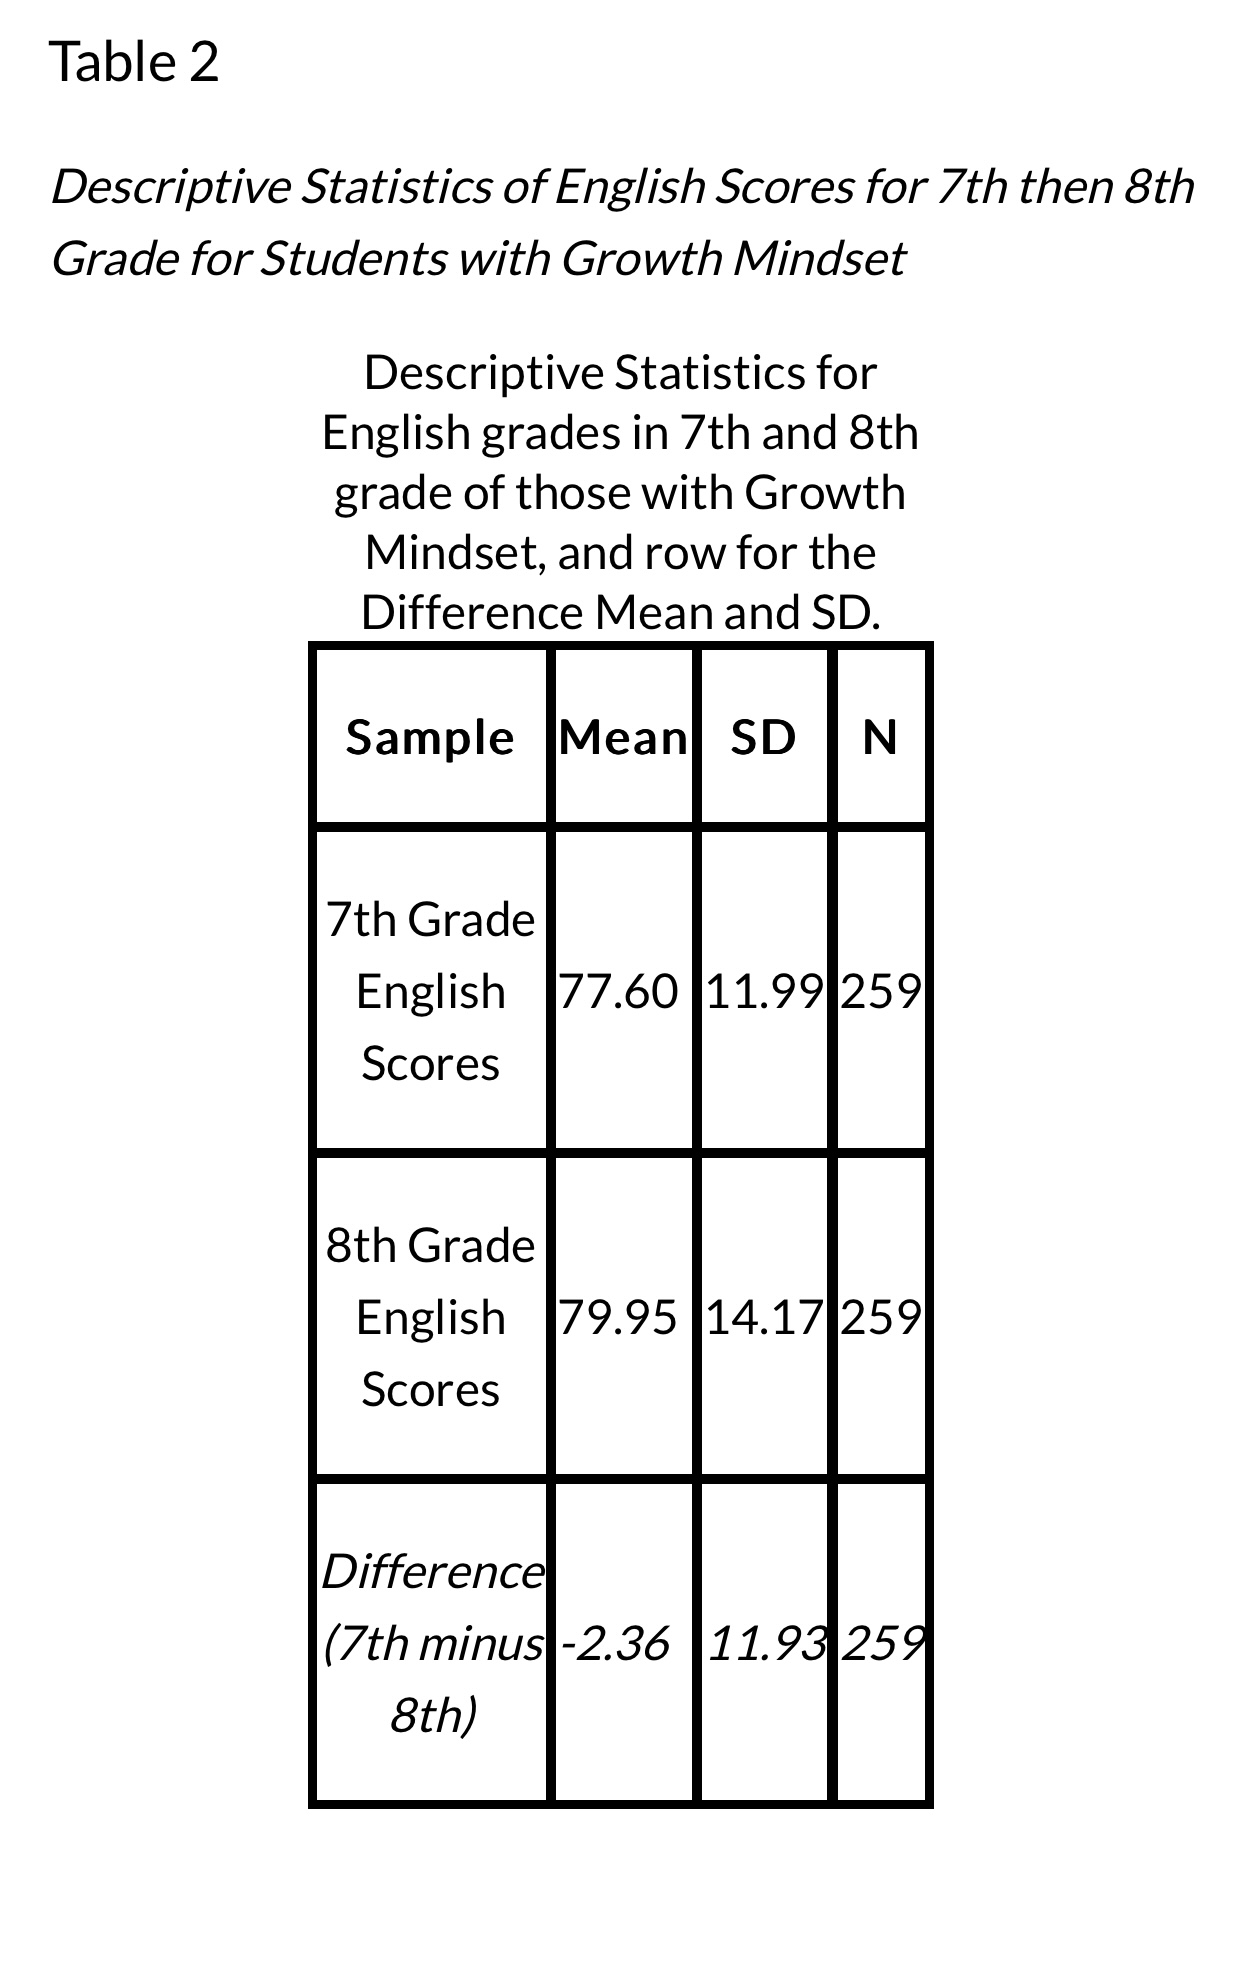
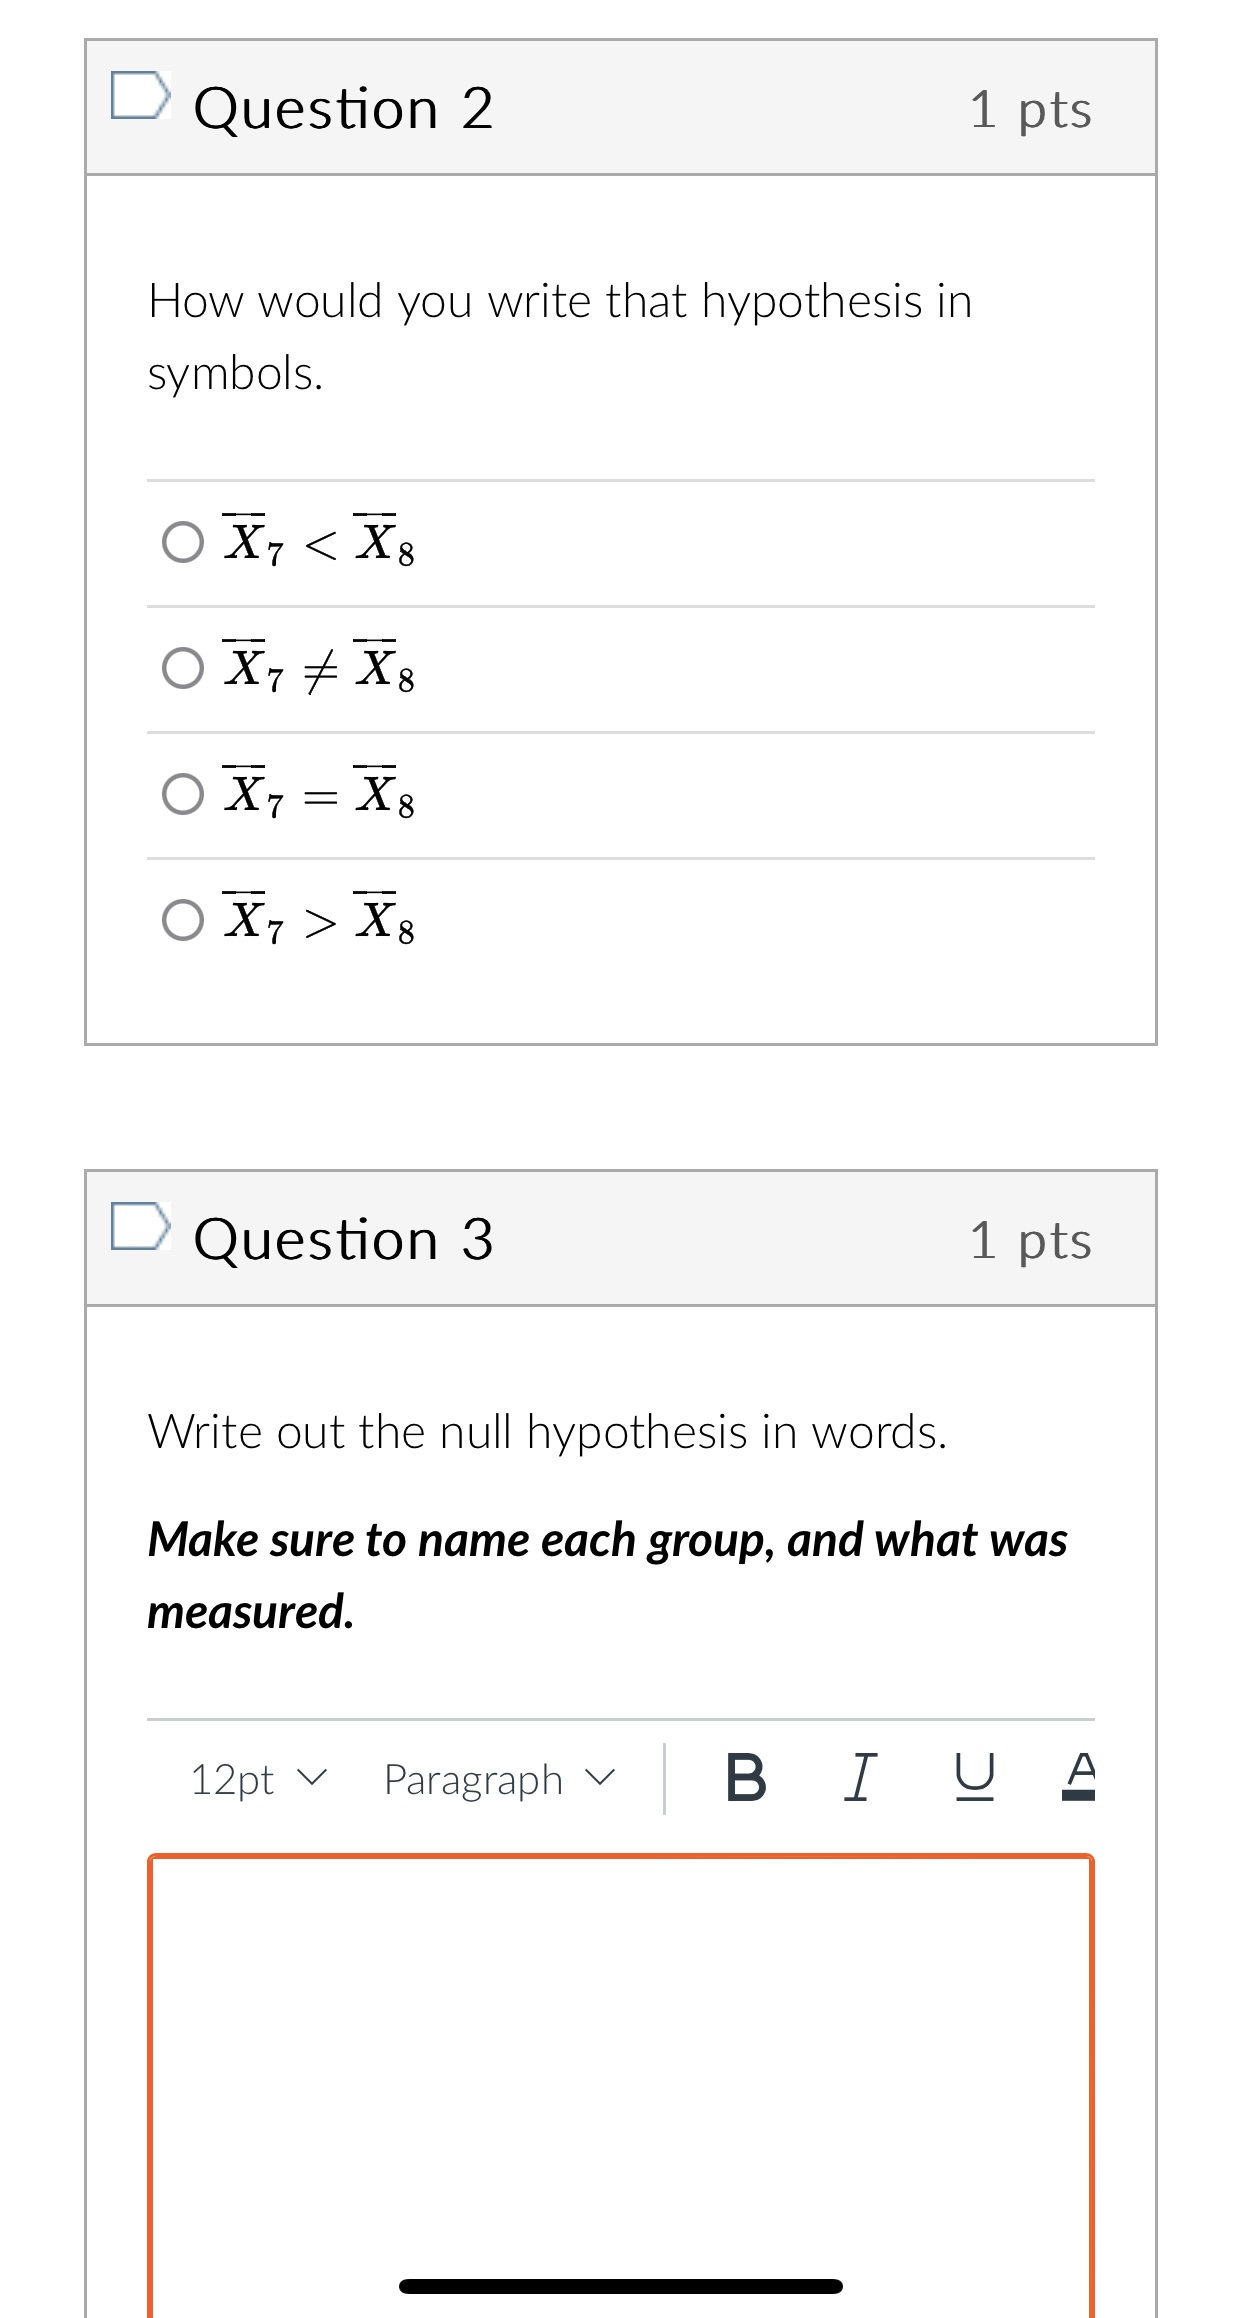
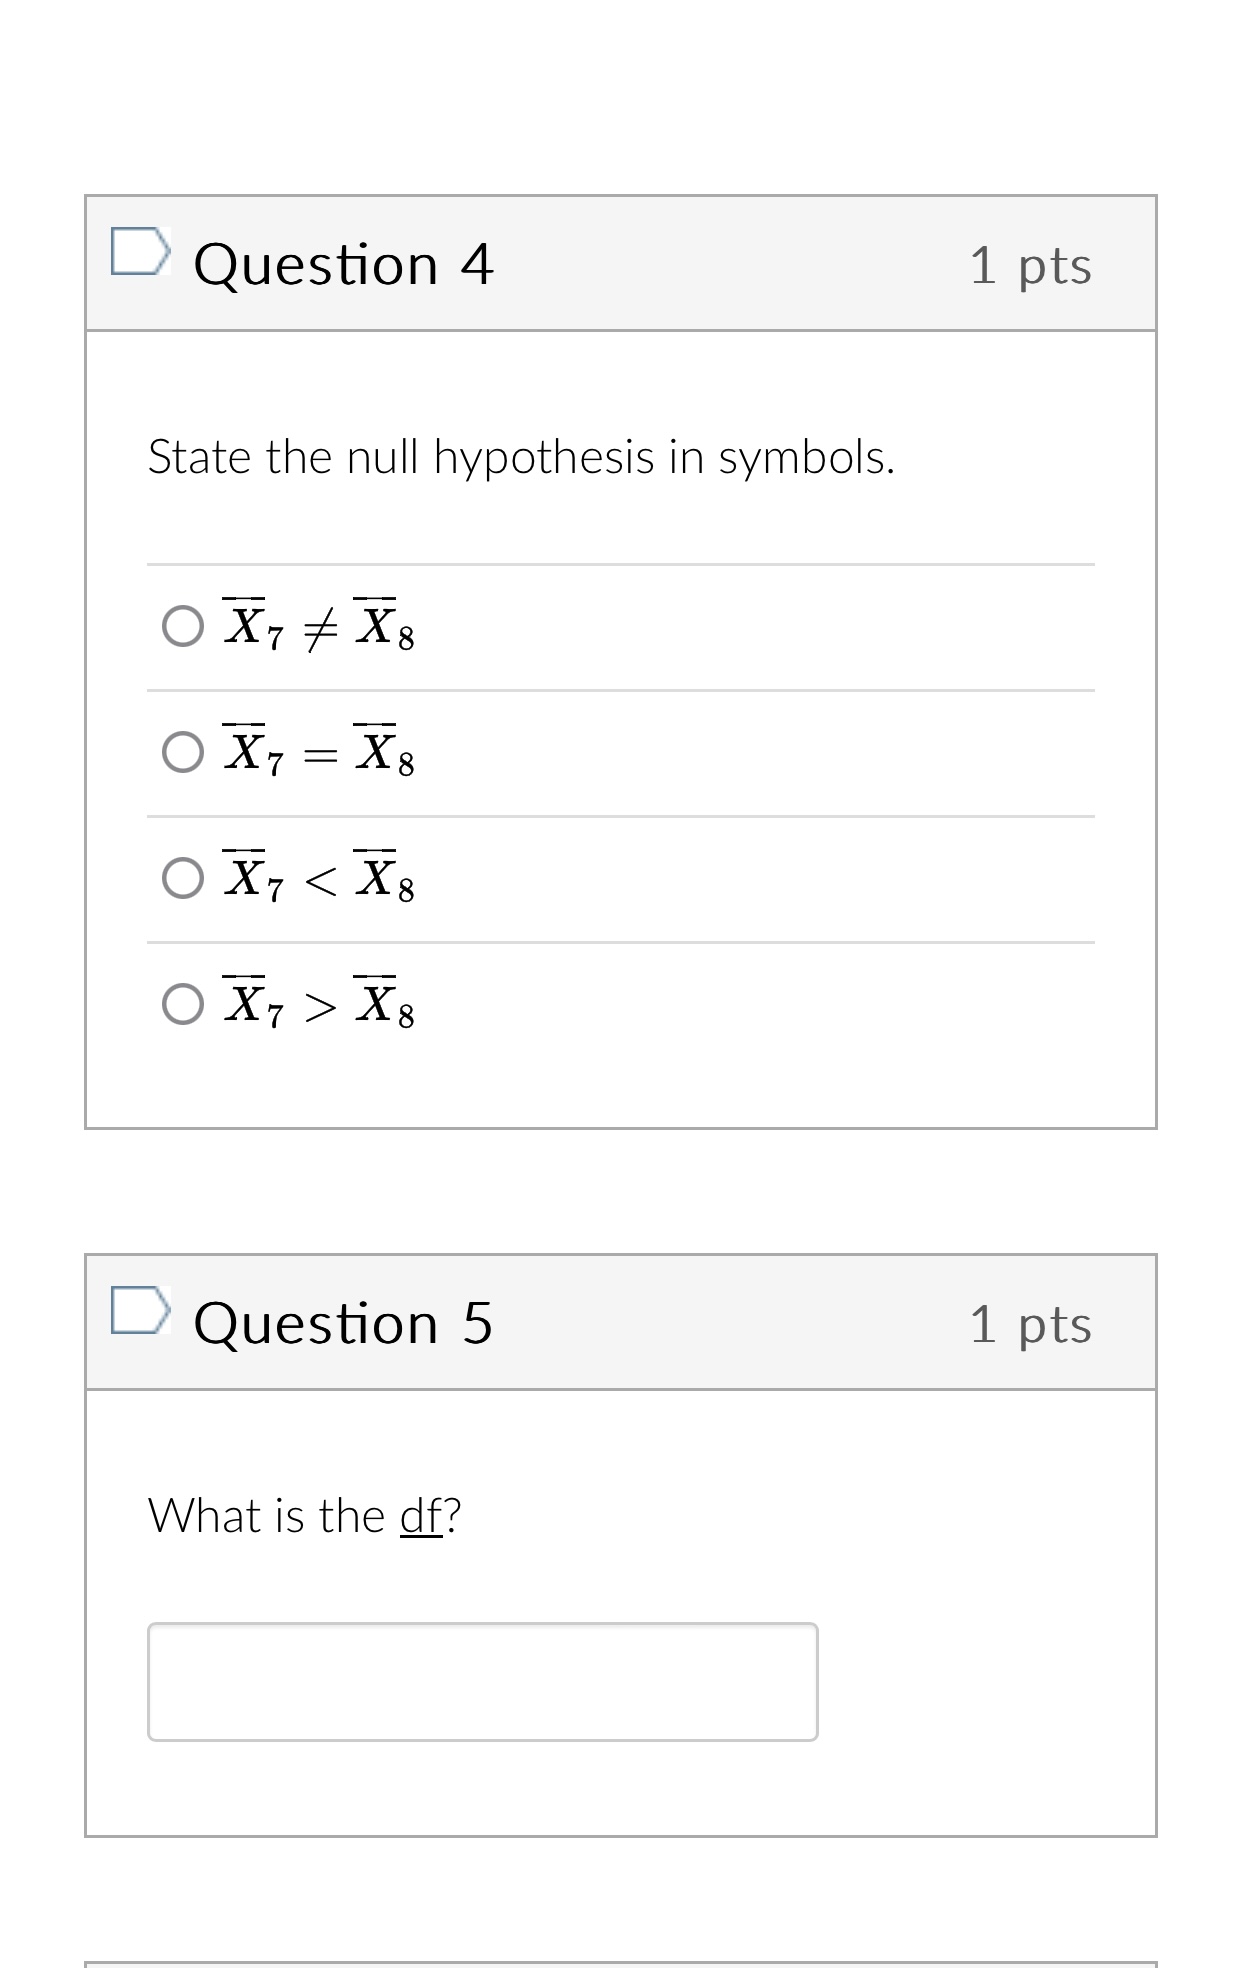
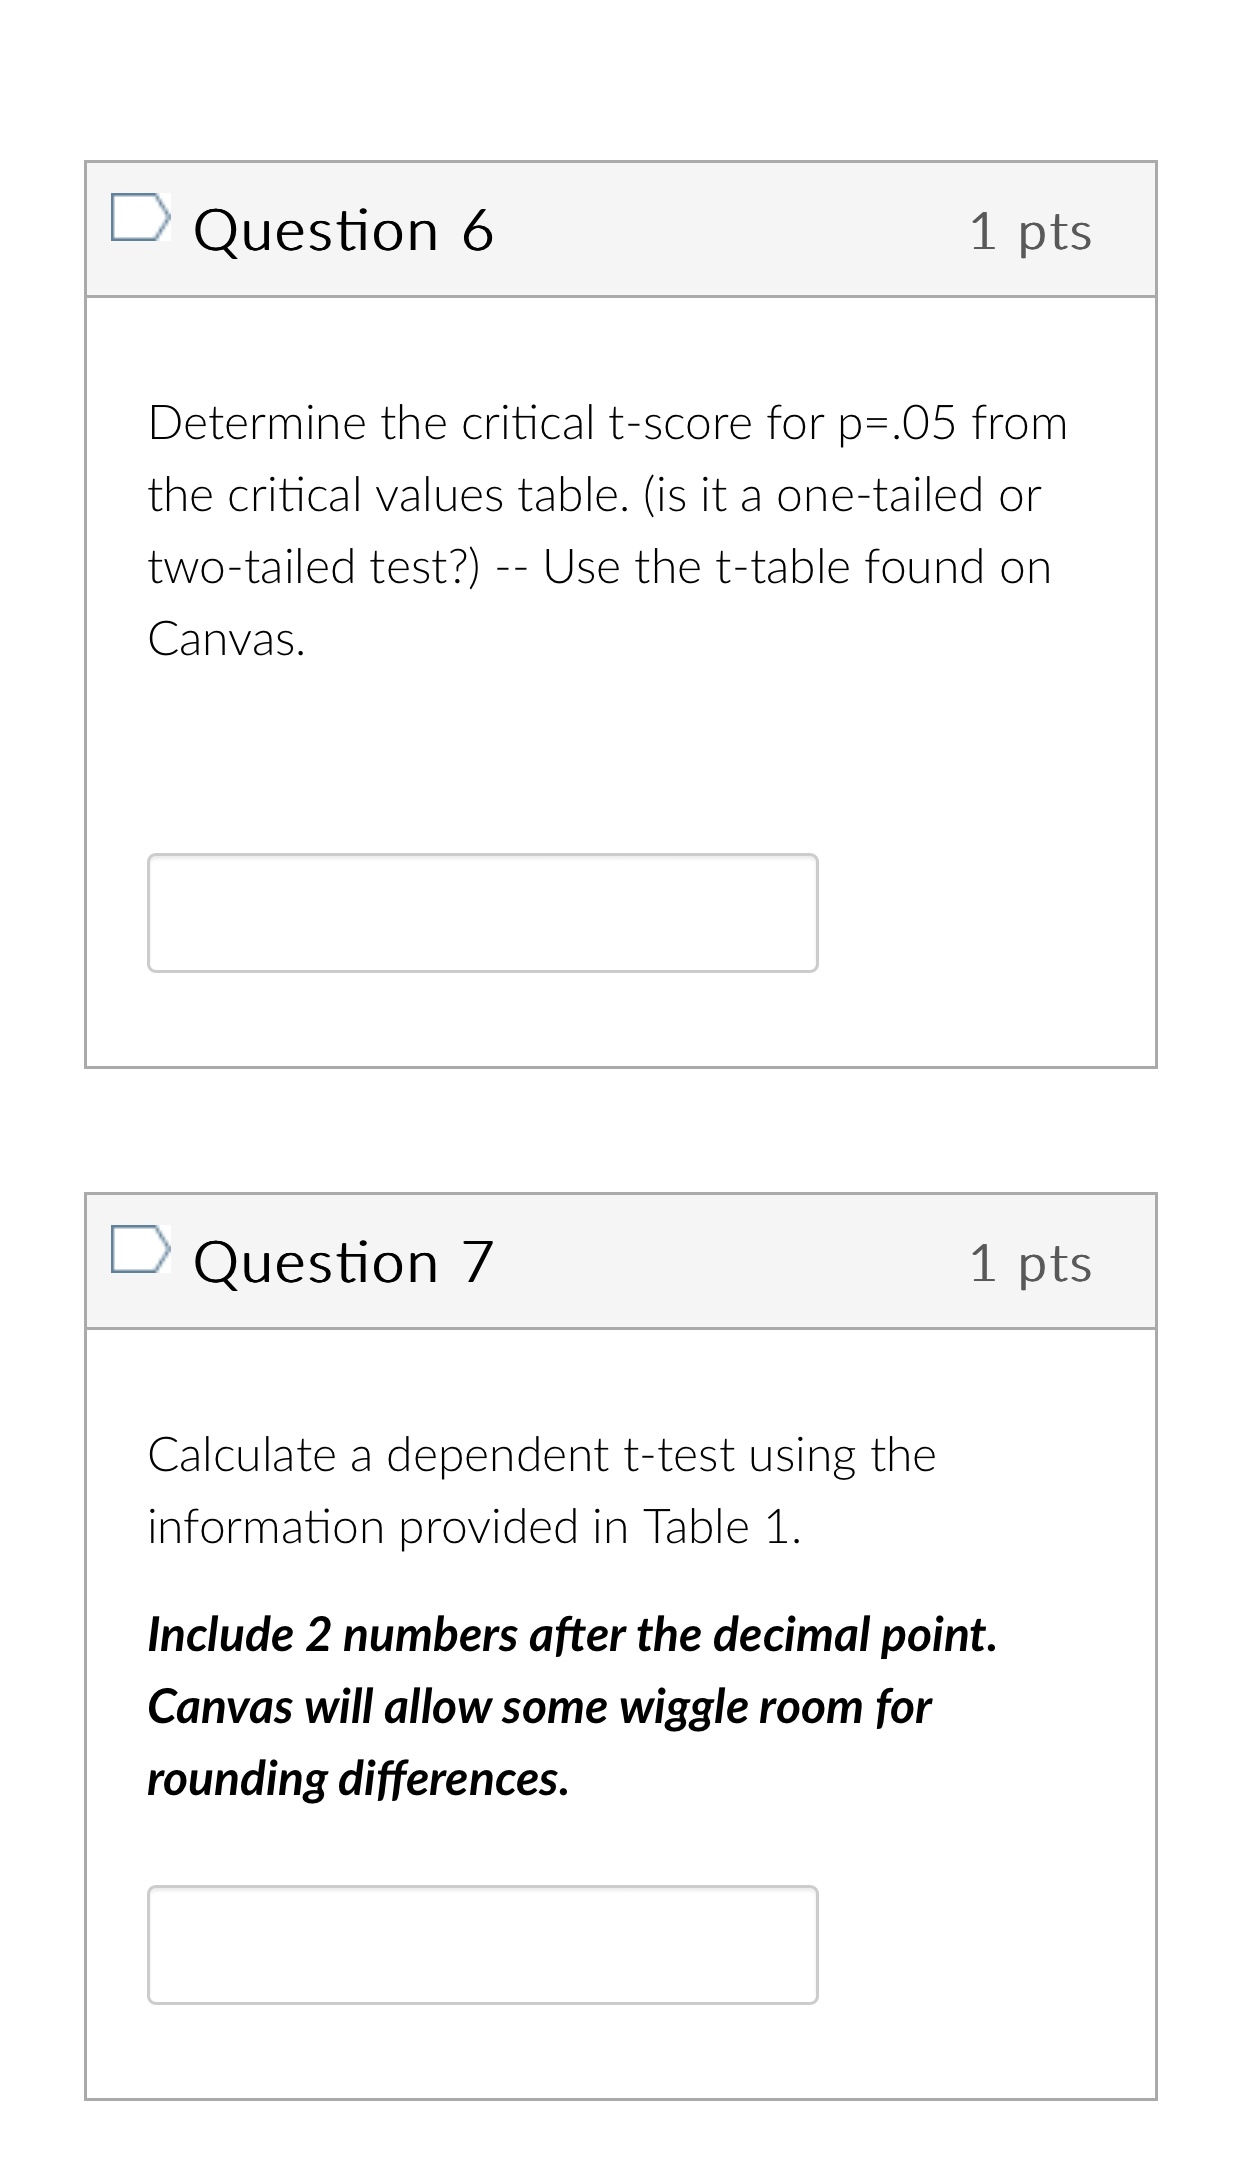
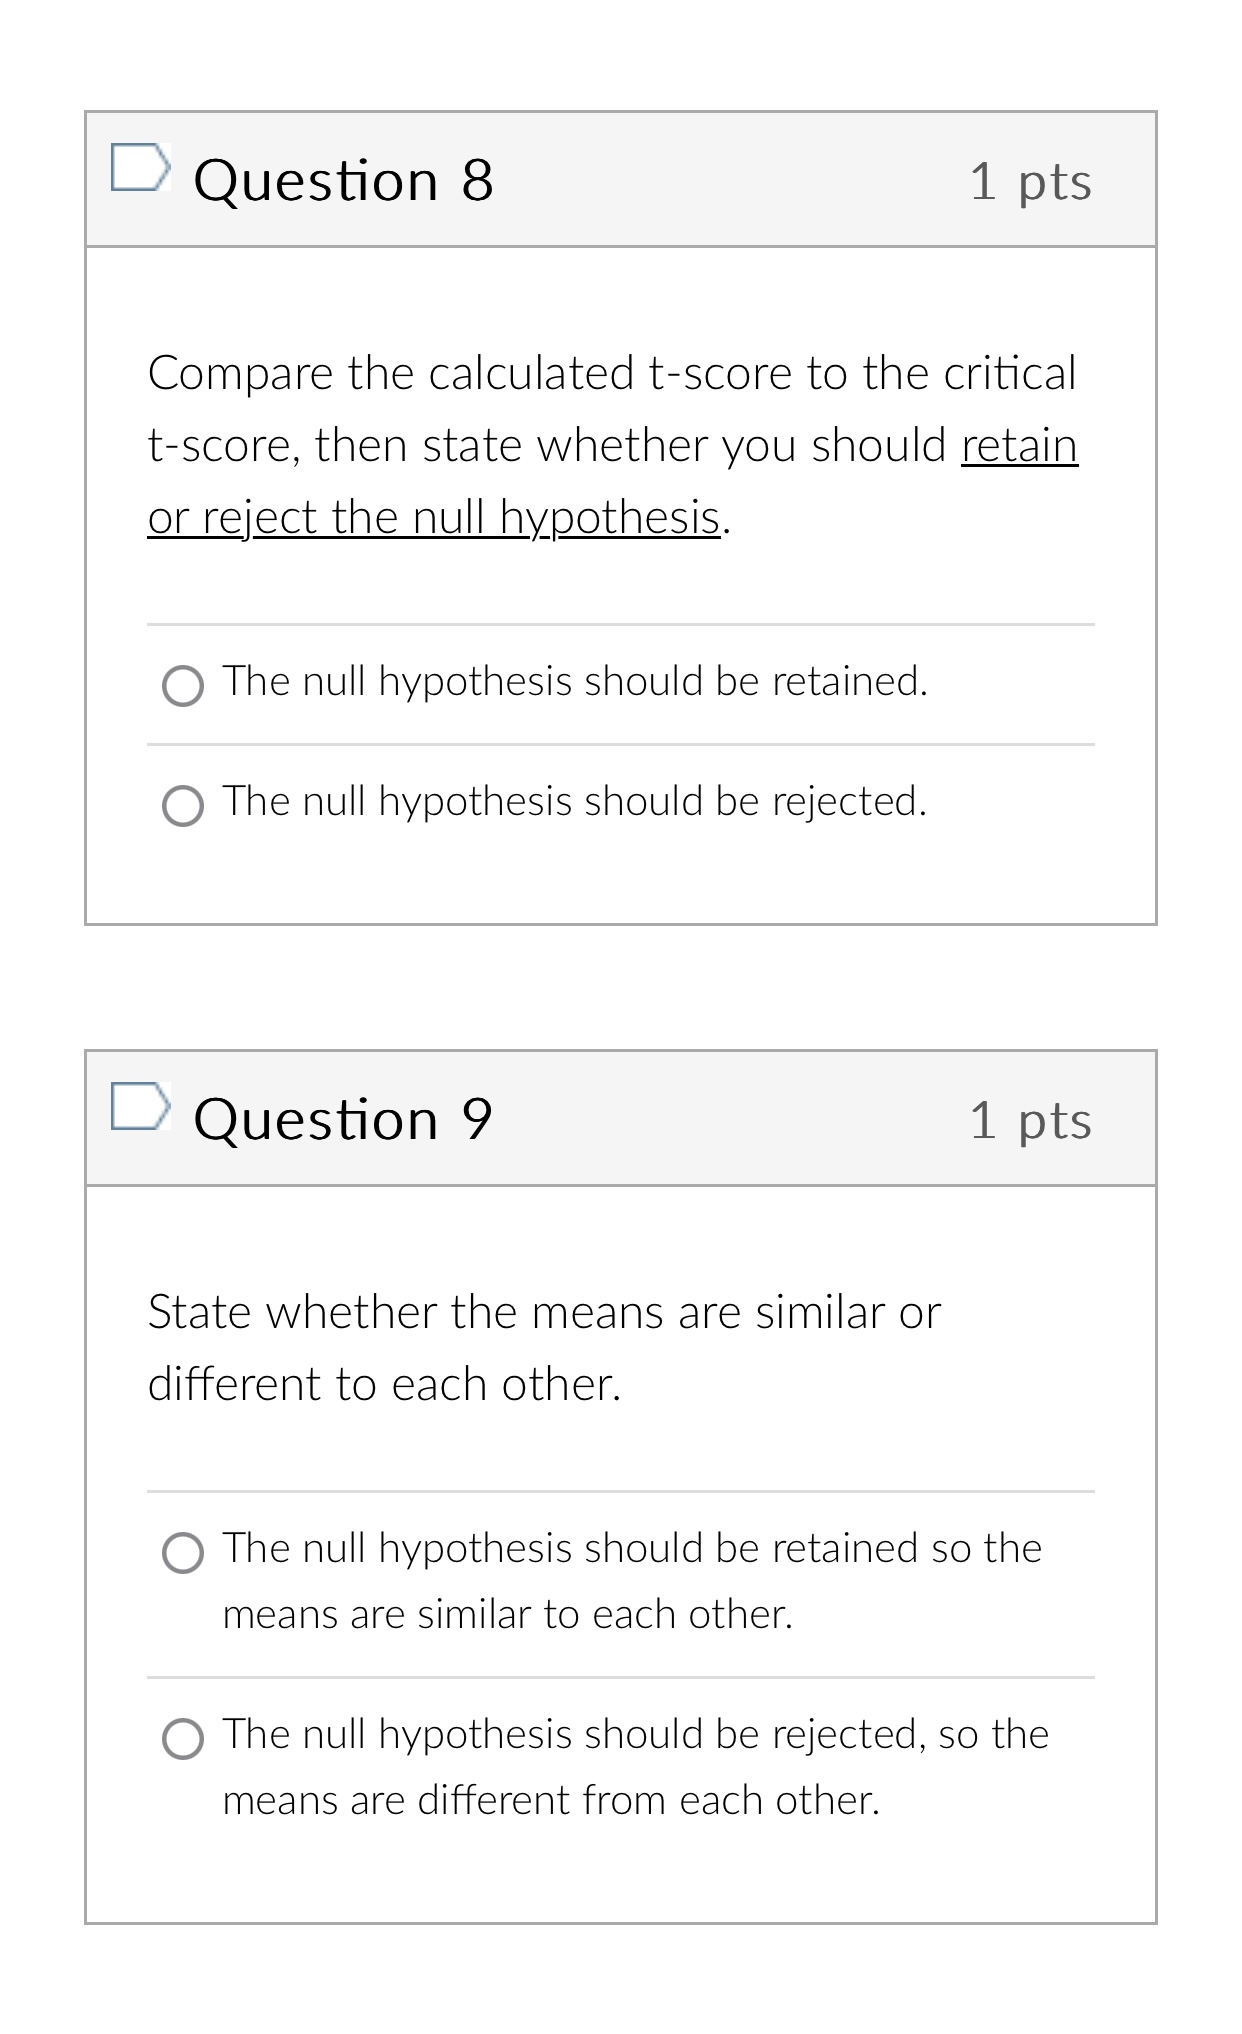
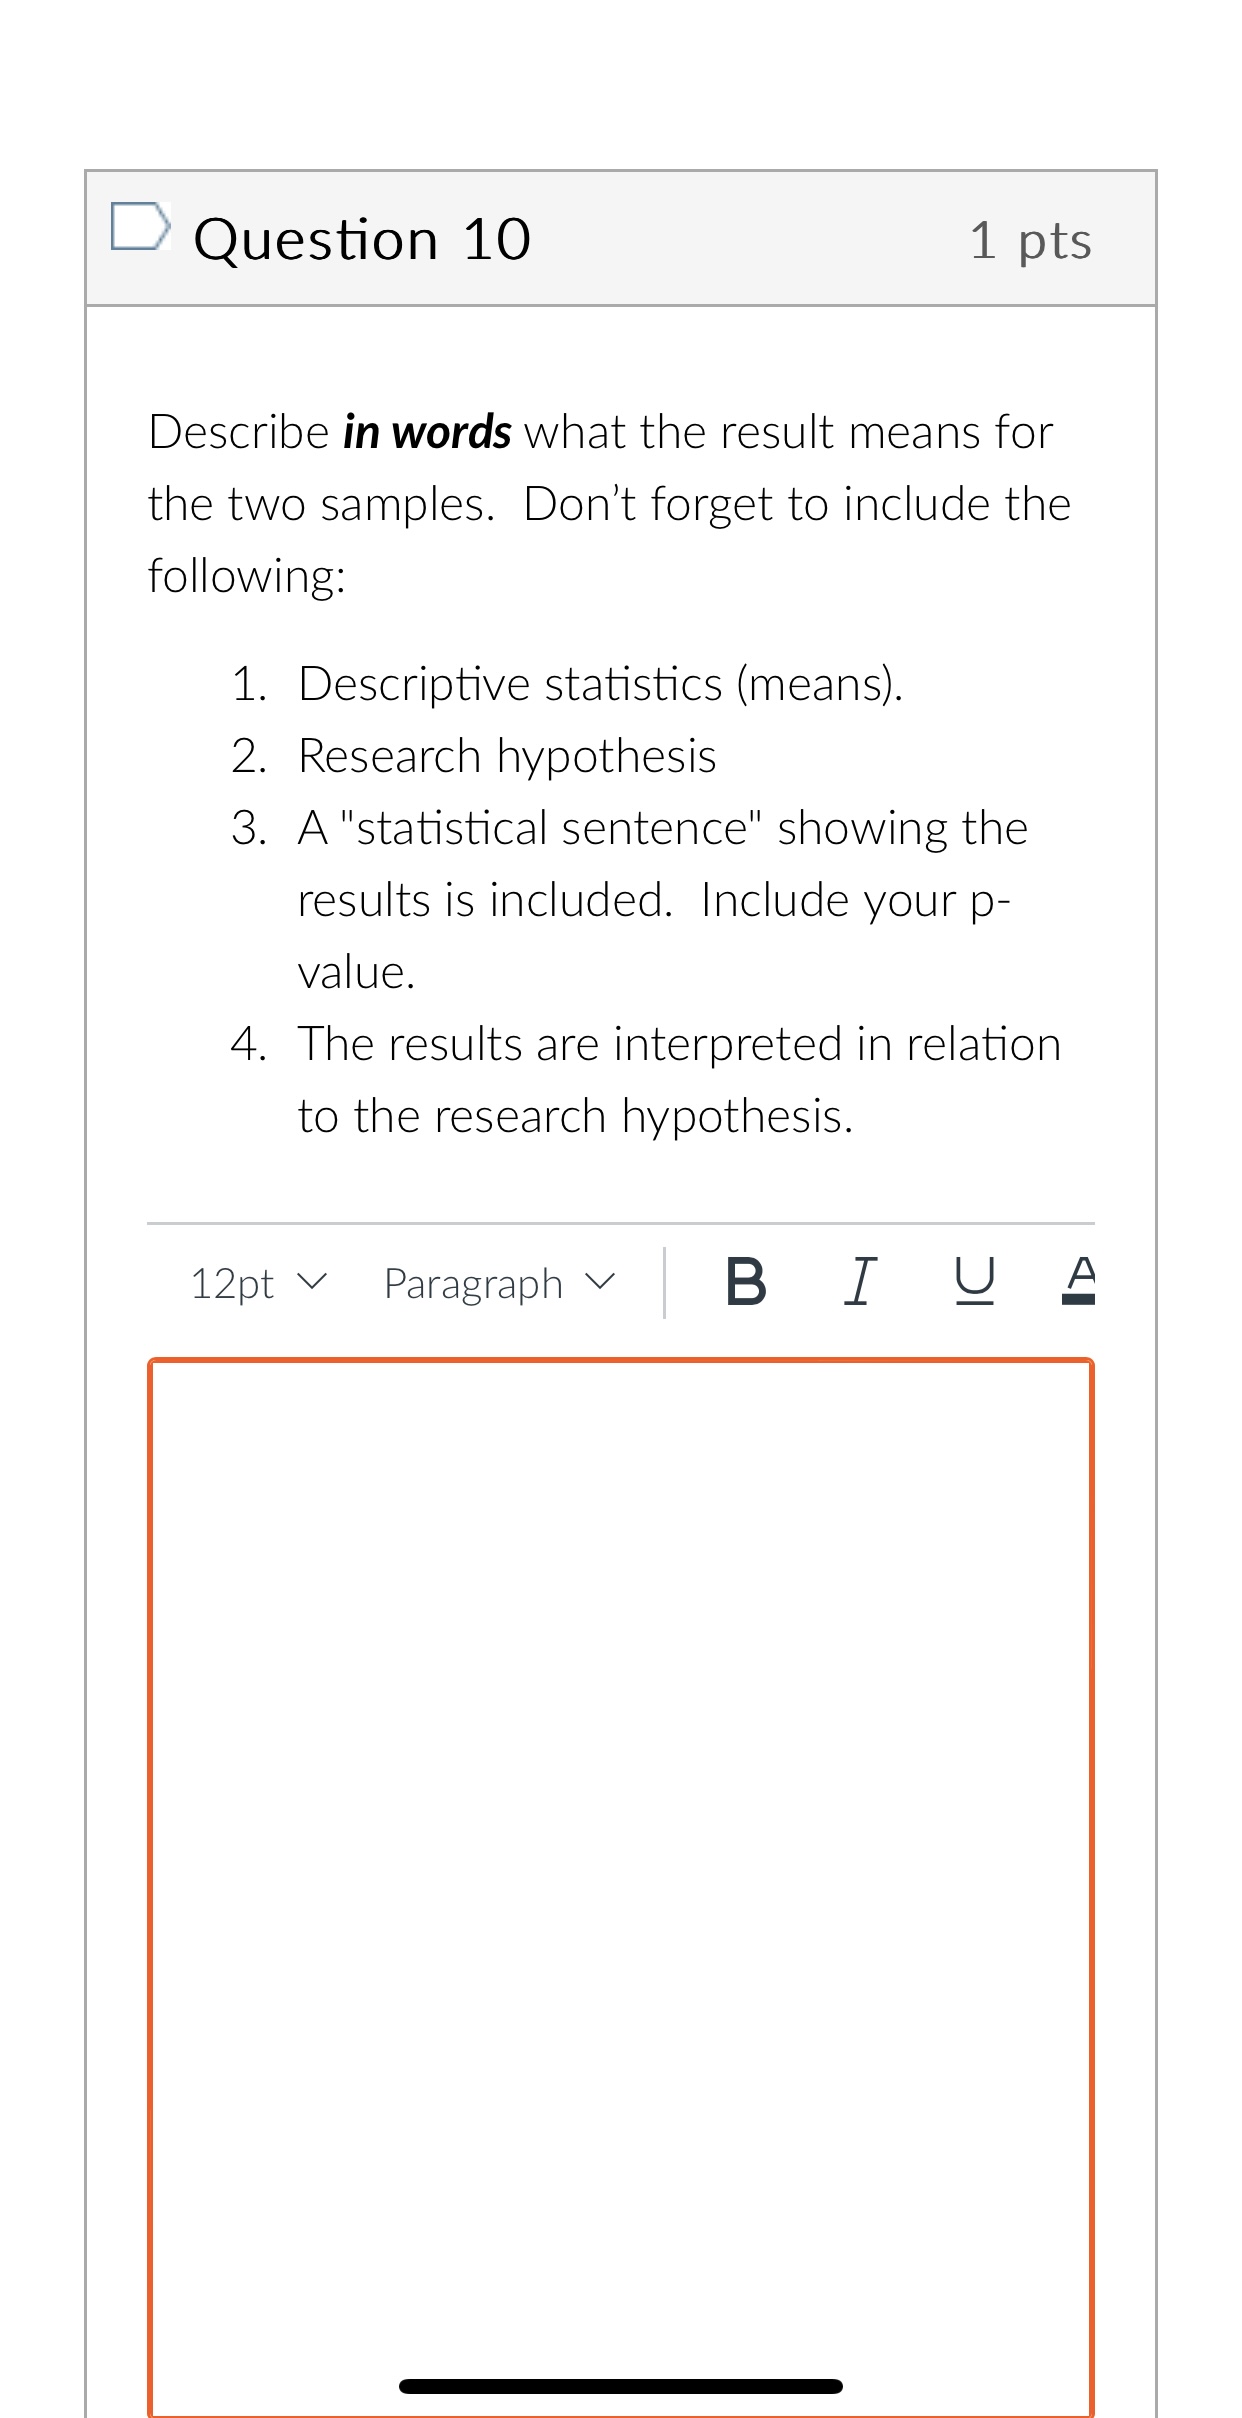
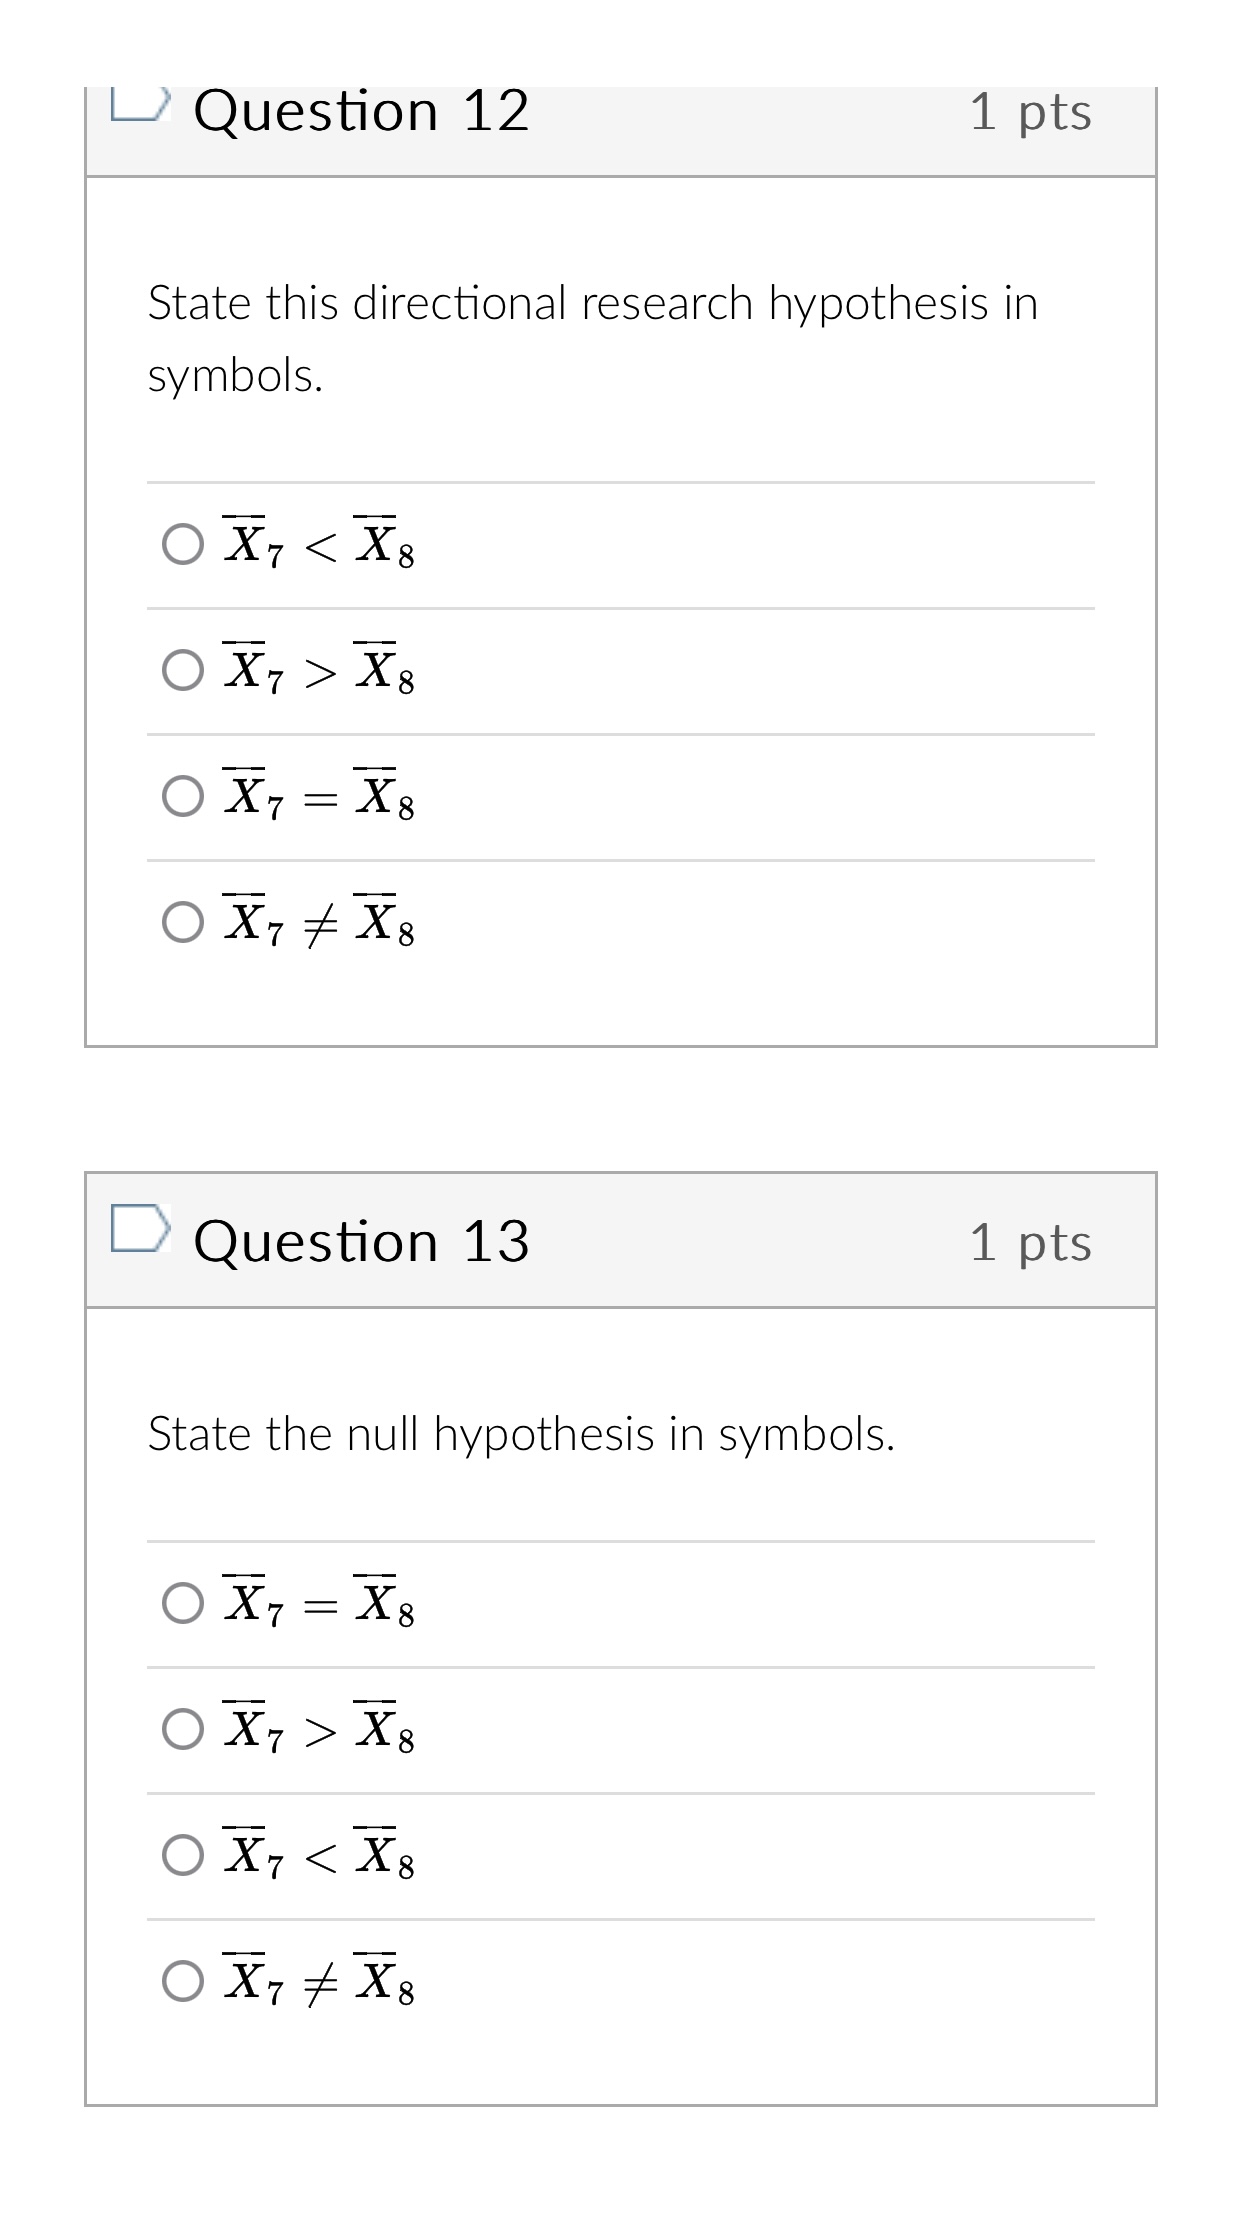
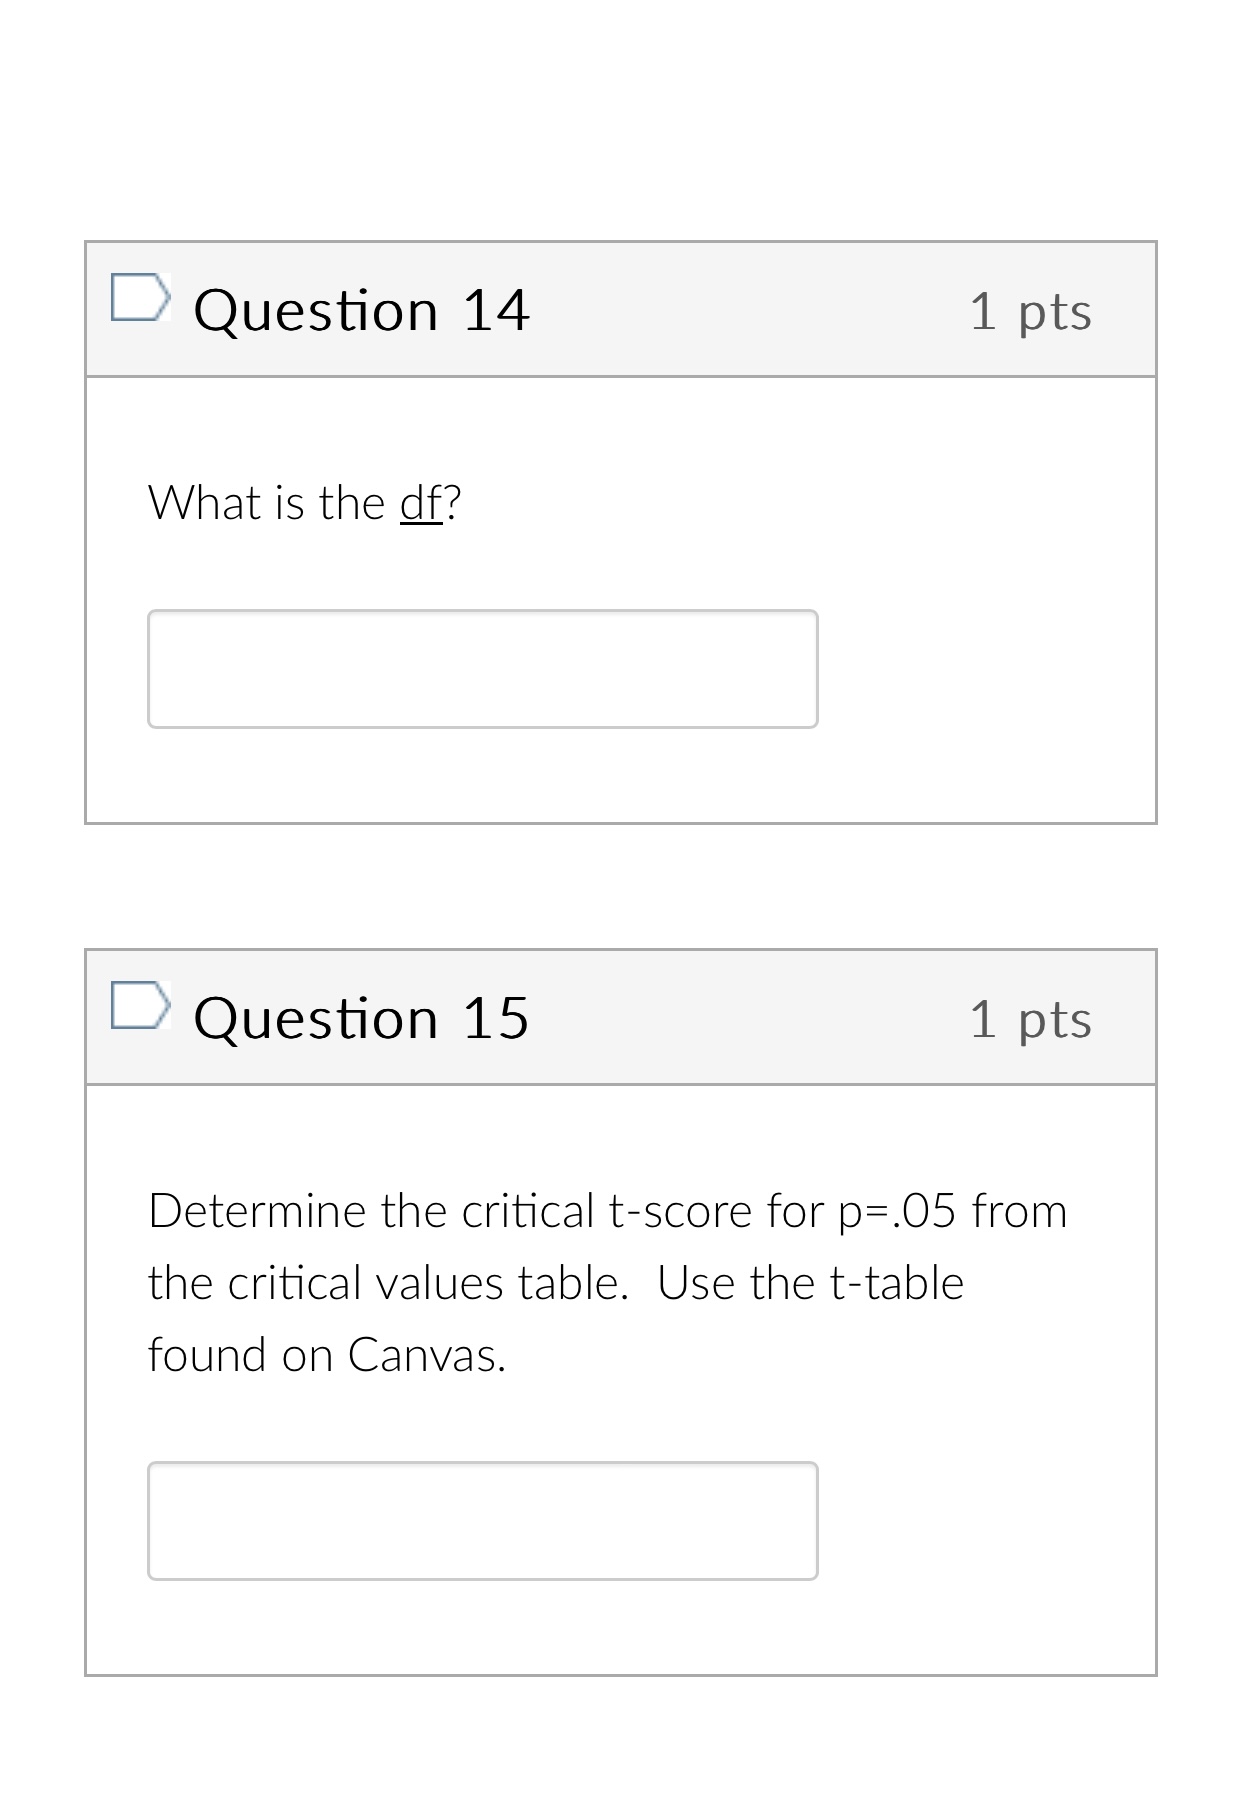
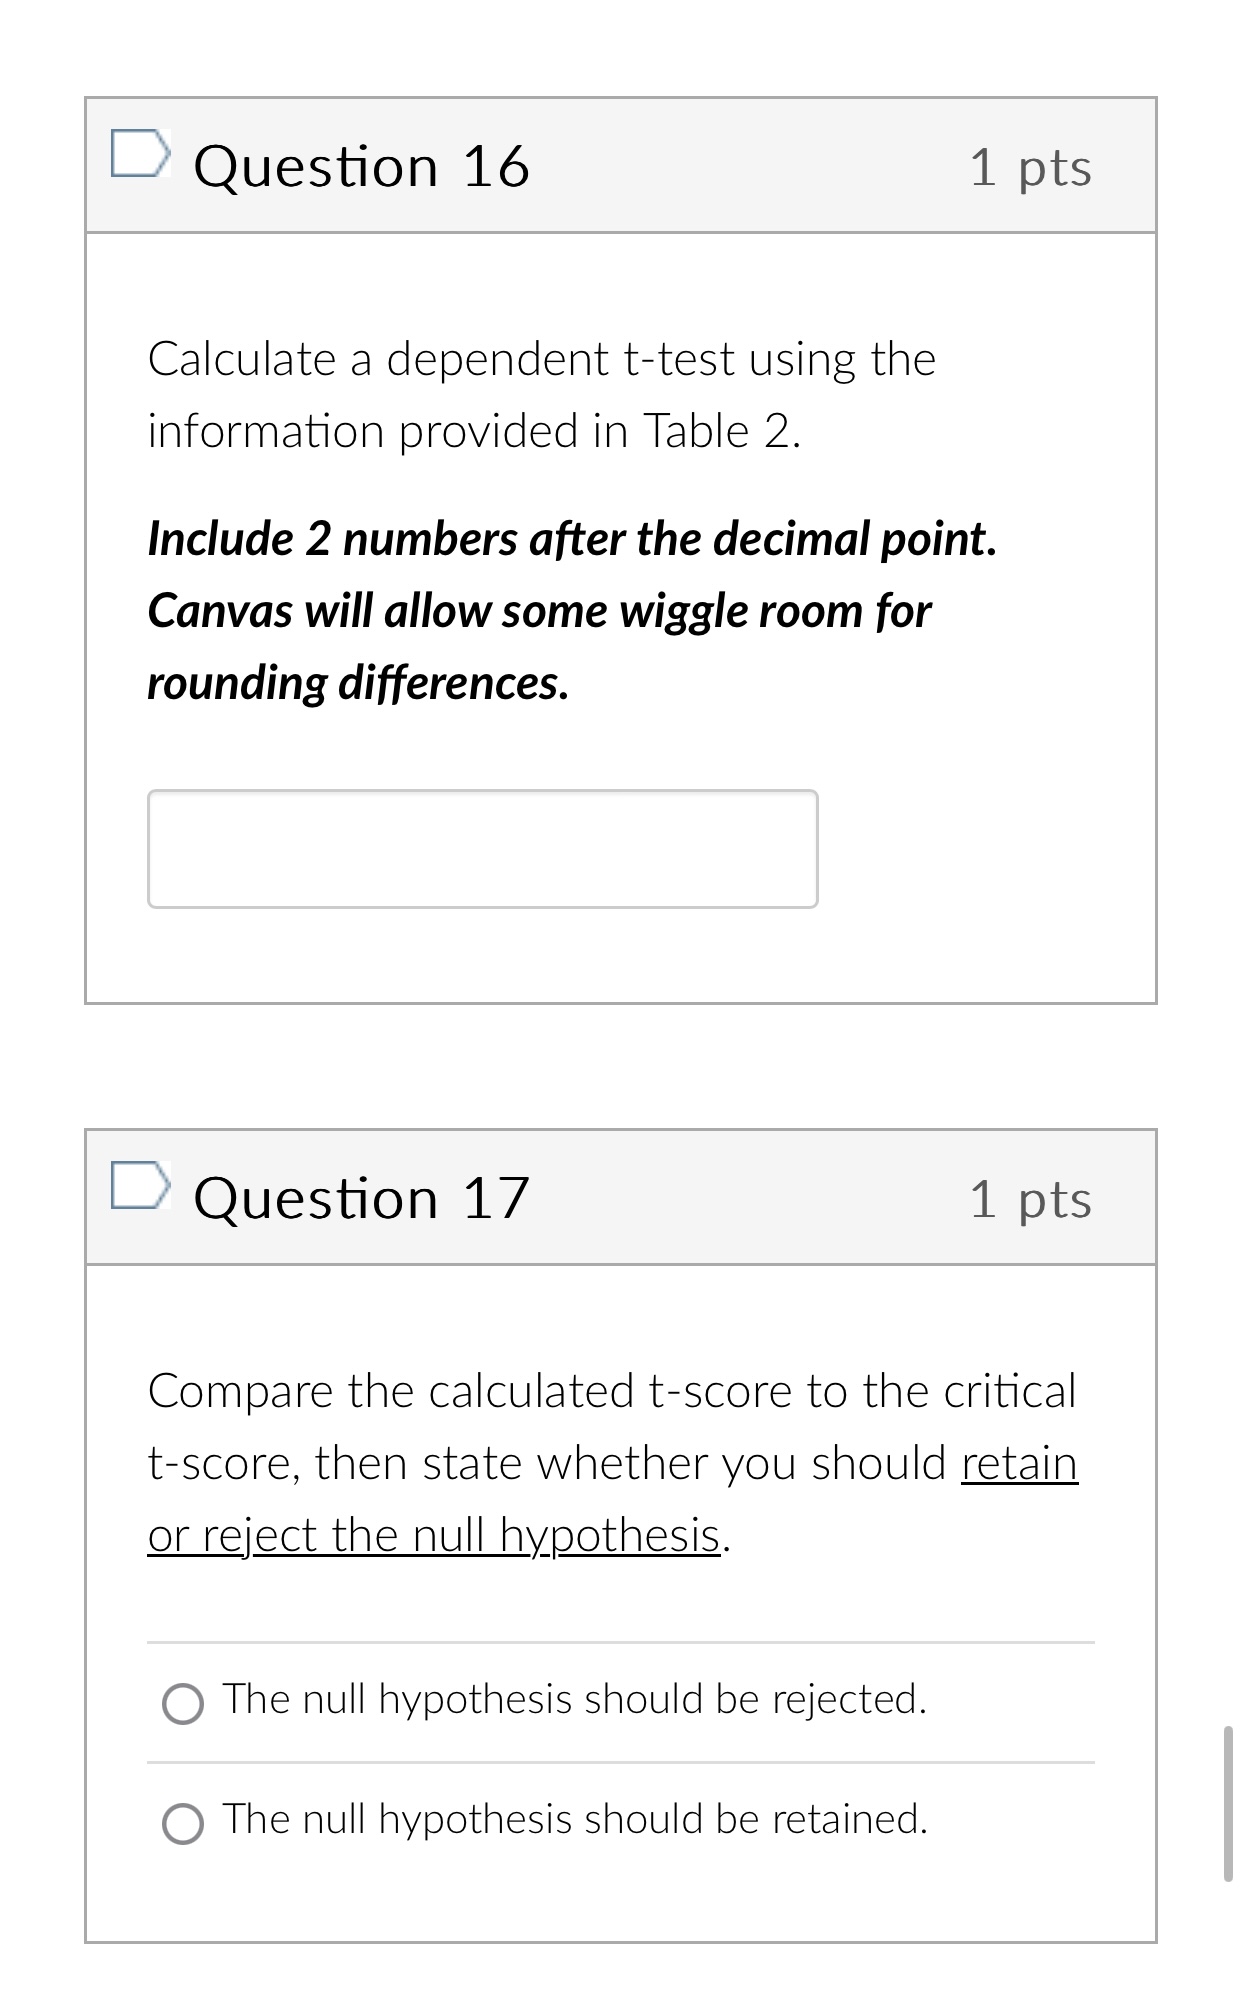
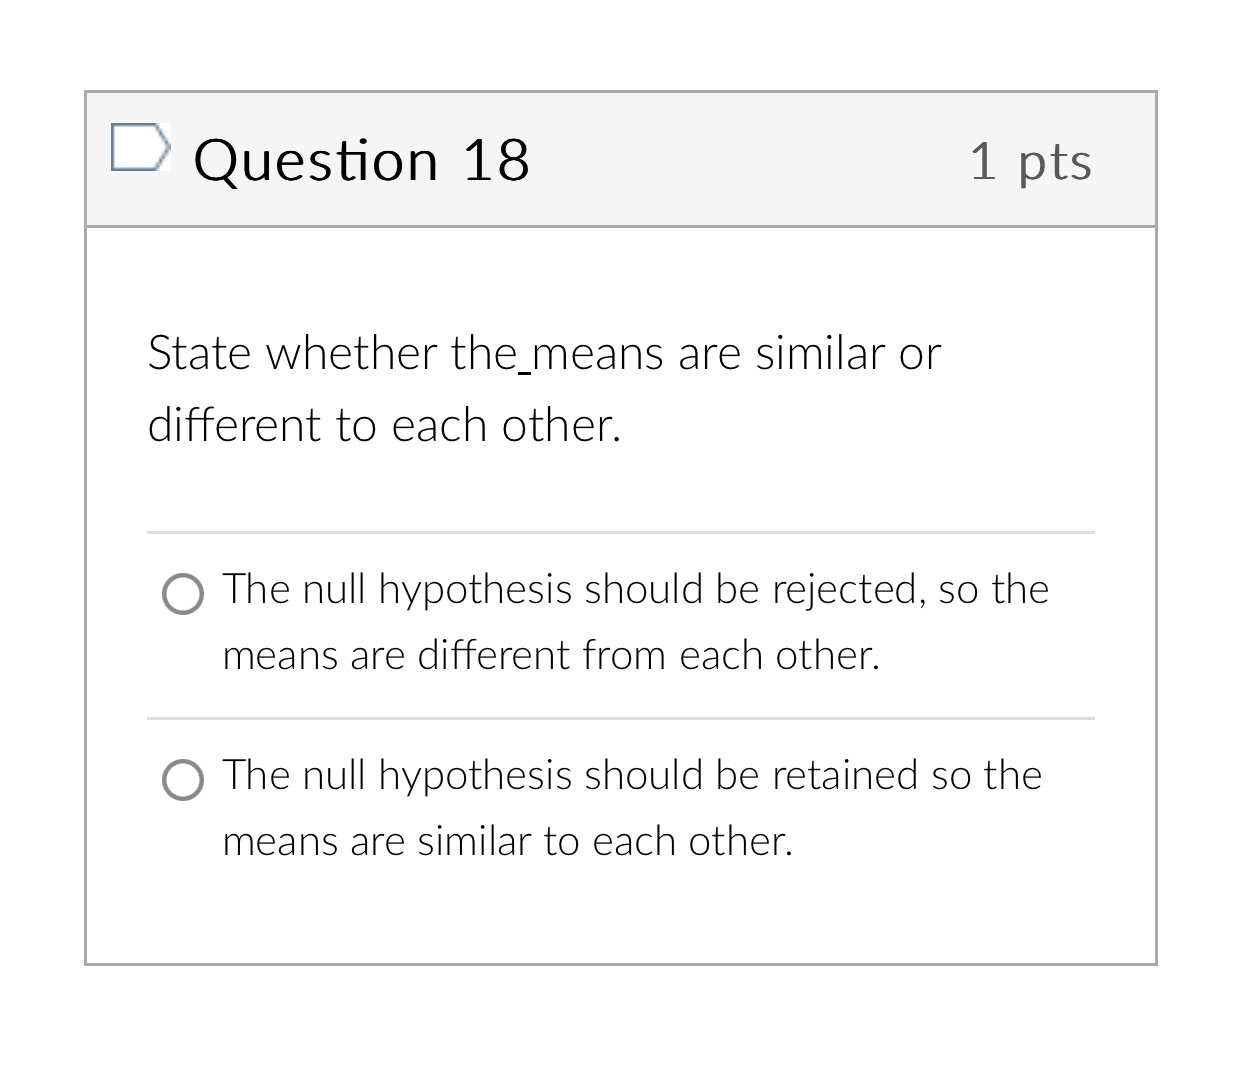
Instructions: Complete the quiz in Canvas by answering the questions from the worksheet using the information provided for each scenario in Tables 1-2. You will be using grade data from a study by Blackwell, Trzesniewski, and Dweck (2007) that measured the same students' grades in their math and English class (out of 100-point scale) at the end of 7th grade and at the end of 8th grade. You are given data about their grades in English. The theory behind "growth mindset" is that people who score higher on "growth mindset" tend to perform better than those with a "fixed mindset." In this analysis we are not yet directly comparing growth vs fixed mindset. We want to know If students who have growth mindset improve in school performance year-by-year. We will separately compare the progress of students with a fixed mindset - we are not sure if "fixed mindset\" student''s performance will increase or decrease. Note: The mean difference and the standard deviation of the differences are calculated for you. Table 1 Descriptive Statistics of English Scores for 7th then 8th Grade for Students with Fixed Mindset Descriptive Statistics for English grades in 7th and 8th grade of those with Fixed Mindset, and row for the Difference Mean and SD. Sample Mean SD N 7th Grade English 74.97 11.28 79 Scores 8th Grade English 78.17 15.05 79 Scores Difference (7th minus -3.19 11.93 79 8th)Table 2 Descriptive Statistics of English Scores for 7th then 8th Grade for Students with Growth Mindset Descriptive Statistics for English grades in 7th and 8th grade of those with Growth Mindset, and row for the Difference Mean and SD. Sample Mean SD N 7th Grade English 177.60 11.99 259 Scores 8th Grade English 79.95 14.17 259 Scores Difference (7th minus -2.36 11.93 259 8th)L Question 1 1 pts We will start with the data on fixed mindset, found in Table 1. We are not sure how we expect scores for "fixed mindset" students to change. What might your alternative hypothesis be? Make sure to name each group, and what was measured. 12pt ~ Paragraph Vv B I L_J p Owords = > ,/' L Question 2 1 pts How would you write that hypothesis in symbols. O_XF{ <_ o x7 x5 o_x7>_X8 L Question 3 1 pts Write out the null hypothesis in words. Make sure to name each group, and what was measured. 12pt v Paragraph v B I Q Question 4 1 pts State the null hypothesis in symbols. O X7 # X 8 O X7 = X 8 O X7 X 8 Question 5 1 pts What is the df?Question 6 1 pts Determine the critical t-score for p=.05 from the critical values table. (is it a one-tailed or two-tailed test?) -- Use the t-table found on Canvas. Question 7 1 pts Calculate a dependent t-test using the information provided in Table 1. Include 2 numbers after the decimal point. Canvas will allow some wiggle room for rounding differences.. Question 8 1 pts Compare the calculated t-score to the critical t-score, then state whether you should retain or reject the null hypothesis. (O The null hypothesis should be retained. (O The null hypothesis should be rejected. . Question 9 1 pts State whether the means are similar or different to each other. (O The null hypothesis should be retained so the means are similar to each other. (O The null hypothesis should be rejected, so the means are different from each other. L Question 10 1 pts Describe in words what the result means for the two samples. Don't forget to include the following: 1. Descriptive statistics (means). 2. Research hypothesis 3. A'statistical sentence" showing the results is included. Include your p- value. 4. The results are interpreted in relation to the research hypothesis. 12pt v Paragraph v B I U A L Question 11 1 pts Now we will focus on the data from "growth mindset" students, provided in Table 2. We would expect that students with growth mindset will improve thier scores year-by- year. Based on this, determine a directional research hypothesis in words. Make sure to name each group, and what was measured. I> 12pt v Paragraph v B [/ U p @ Owords = > ,/' Question 12 1 pts State this directional research hypothesis in symbols. OXY X 8 O X7 = X8 O X, # X8 Question 13 1 pts State the null hypothesis in symbols. O X1 = X 8 O X 7 > X 8 O X7
Step by Step Solution
There are 3 Steps involved in it
Step: 1
Get Instant Access to Expert-Tailored Solutions
See step-by-step solutions with expert insights and AI powered tools for academic success
Step: 2
Step: 3
Ace Your Homework with AI
Get the answers you need in no time with our AI-driven, step-by-step assistance