Question
Instructions Demographics: Part 1: Demographics Info and You Video Watch the Demographics Info and You Video and take notes. 1. Give a page
Instructions | |
Demographics:
Part 1: Demographics Info and You Video Watch the Demographics Info and You Video and take notes. 1. Give a page overview of the major changes predicted for the US with at least 3 specific applications to how they could affect you personally and your future career. Part 2: US Generational Data: Click on the link below to review U.S. Generational Data (if the link does not open you may need to copy the link and copy it into your browser to view). http://www.cnn.com/interactive/2011/05/living/infographic.boomer/index.html 2. Use the generational trends from the Demographics Info and You Video and the US Generational Data above to make 3 generational observations that you feel will impact you in the future. Part 3: World GDP Data: Review the World GDP Pie Chart. 3. Compare the 2 largest economies. What do you think that means? 4. Select one more country and compare it to the largest 2. What do you think that means?
Part 4: World Population Data: Watch the Historical Growth Video (use the white MENU drop-down and then click on Watch Video). 5. What did you notice...3 observations and implications?
Review the World Population (2022) Tables. 6. Compare at least 3 of the statistical variables between the populations of the largest 3 countries. What do they mean? 7. Select one more country of interest to you and compare it to the largest 3. What interesting observations did you notice? | |
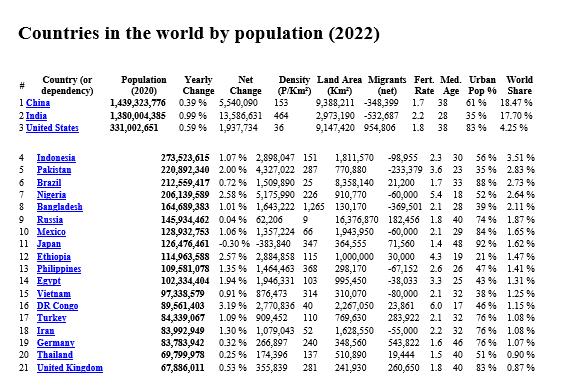
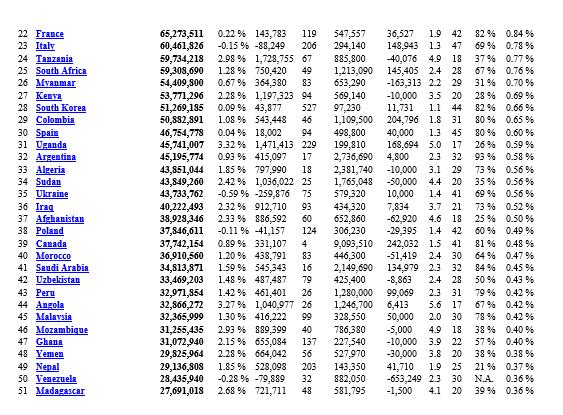
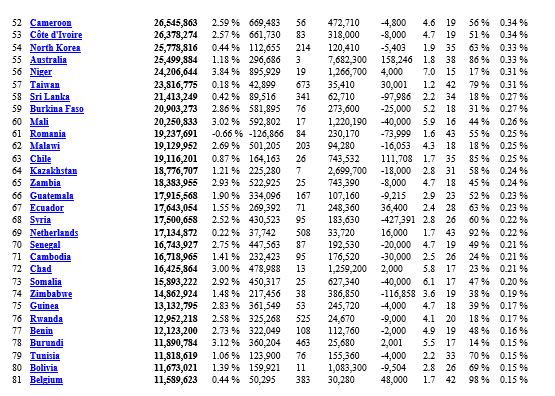
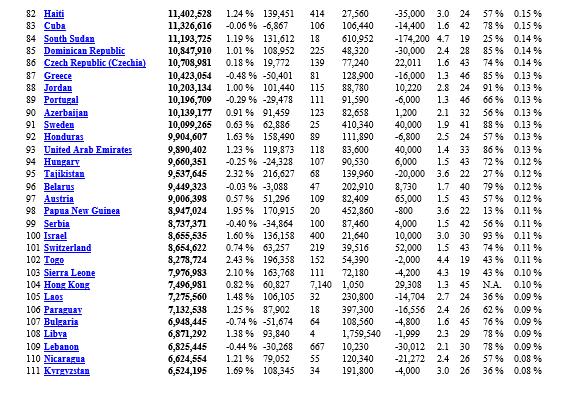
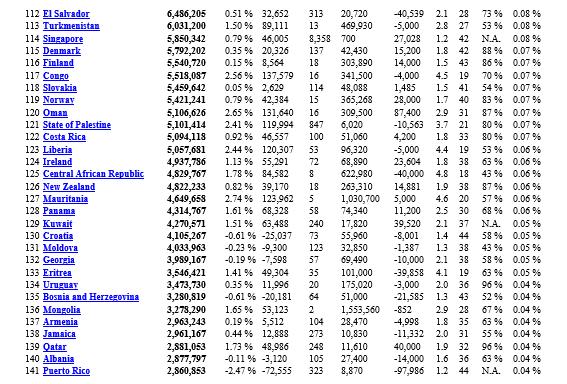
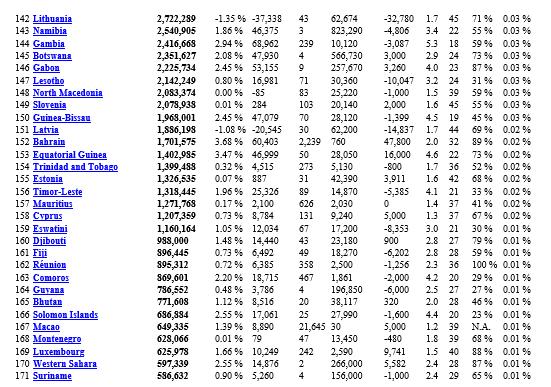
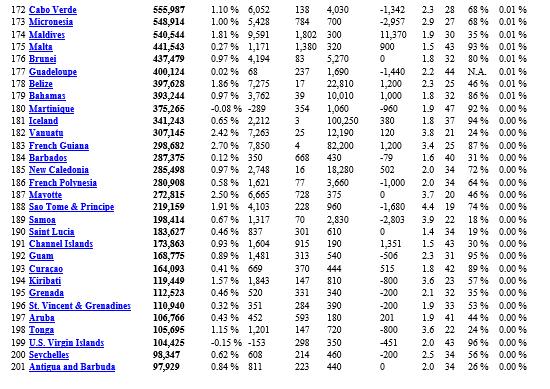
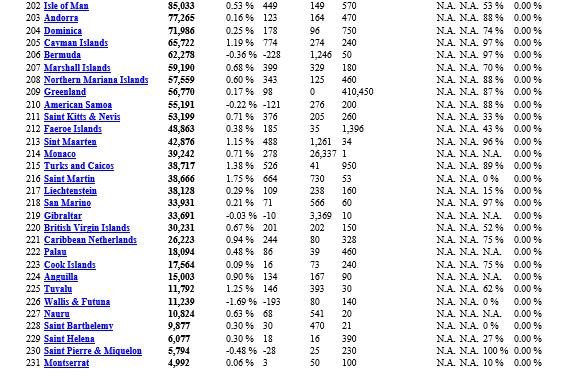

Countries in the world by population (2022) Country (or dependency) Population Yearly (2020) 1,439,323,776 # 1 China 2 India 3 United States 4 Indonesia 5 Pakistan 6 Brazil 7 Nigeria 8 Bangladesh 9 Russia 10 Mexico 11 Japan 12 Ethiopia 13 Philippines 14 Egypt 15 Vietnam 16 DR Congo 17 Turkey 18 Iran 19 Germany 20 Thailand 21 United Kingdom 1,380,004,385 331,002,651 Net Change Change 5,540,090 0.39% 0.99 % 0.59 % Density Land Area Migrants (P/Km) (Km) (net) 9,388,211 -348,399 2,973,190 -532,687 9,147,420 954,806 1.8 38 153 13,586,631 464 1,937,734 36 Fert. Med. Urban World Rate Age Pop % Share 1.7 38 61% 2.2 28 35% 83 % 18.47% 17.70% 4.25 % 21,200 1.7 33 -60,000 5.4 18 273,523,615 1.07% 2,898,047 151 220,892,340 2.00% 4,327,022 287 212,559,417 0.72 % 1,509,890 25 8,358,140 206,139,589 2.58% 5,175,990 226 910,770 164,689,383 1.01 % 1,643,222 1,265 130,170 -369,501 2.1 28 39% 16,376,870 182,456 1.8 40 74% 1,943,950 -60,000 2.1 29 84% 364,555 71,560 1.4 48 92% 1,000,000 30,000 4.3 19 21% 298,170 995,450 -67,152 2.6 26 47% -38,033 33 25 43% 1,811,570 -98,955 2.3 30 770,880 -233,379 3.6 23 145,934,462 0.04% 62,206 9 128,932,753 1.06% 1,357,224 66 126,476,461 -0.30 % 114,963,588 2.57 % 109,581,078 1.35 % 102,334,404 1.94 % -383,840 347 2,884,858 115 1,464,463 368 1,946,331 103 97,338,579 876,473 314 0.91% 3.19 % 89,561,403 2,770,836 40 909,452 110 1.09 % 1.30 % 1,079,043 52 84,339,067 83,992,949 1,628,550 83,783,942 0.32% 266,897 240 348,560 69,799,978 0.25% 174,396 137 510,890 67,886,011 0.53% 355,839 281 241,930 310,070 2,267,050 769,630 56% 35% 88% 52% -80,000 2.1 32 38% 23,861 6.0 17 283,922 2.1 32 -55,000 2.2 32 543,822 1.6 46 19,444 1.5 40 260,650 1.8 40 3.51 % 2.83 % 2.73 % 2.64 % 2.11% 1.87% 1.65 % 1.62% 1.47% 1.41% 1.31% 1.25% 1.15% 1.08 % 46% 76% 76% 1.08% 76% 1.07% 51% 0.90% 83 % 0.87%
Step by Step Solution
There are 3 Steps involved in it
Step: 1
1 Major changes predicted for the US and their potential impact on me and my future career a Aging population The video mentions that the US populatio...
Get Instant Access to Expert-Tailored Solutions
See step-by-step solutions with expert insights and AI powered tools for academic success
Step: 2

Step: 3

Ace Your Homework with AI
Get the answers you need in no time with our AI-driven, step-by-step assistance
Get Started


