Answered step by step
Verified Expert Solution
Question
1 Approved Answer
Instructions: Do not copy from other questions, or i will report you. F2023 MGTS 352 (CC91) Case Assignment - Inventory Management (10%, Total 10 points)
Instructions: 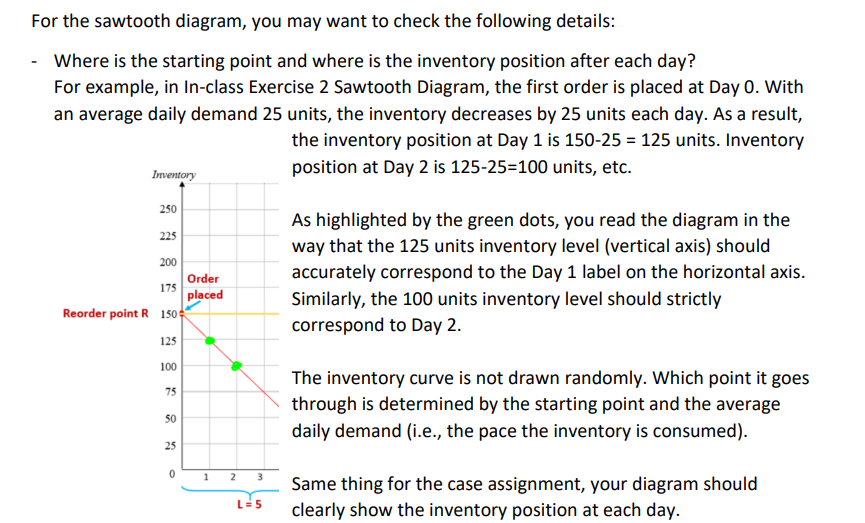

Do not copy from other questions, or i will report you.
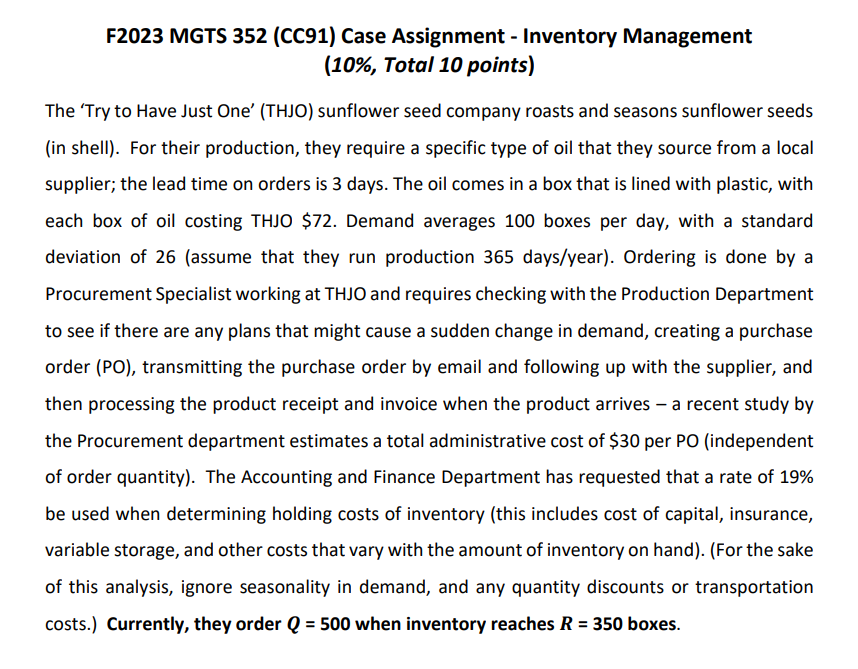
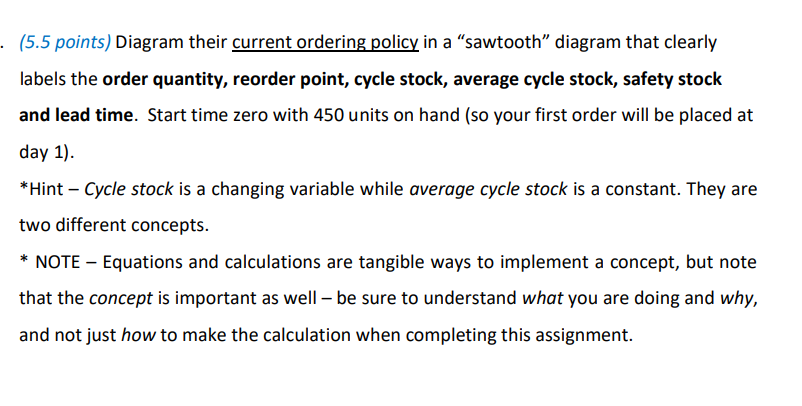
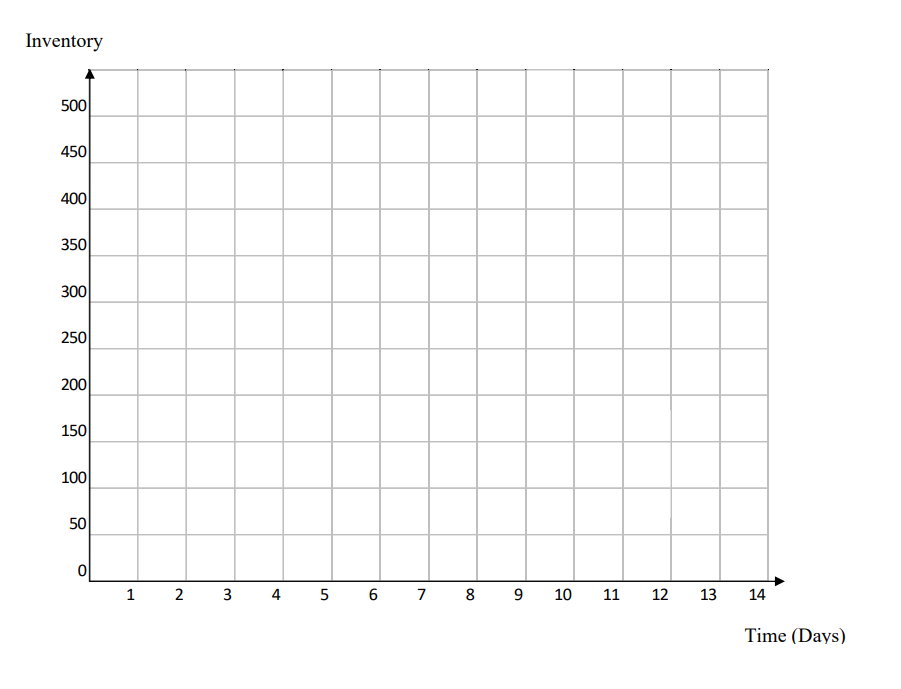
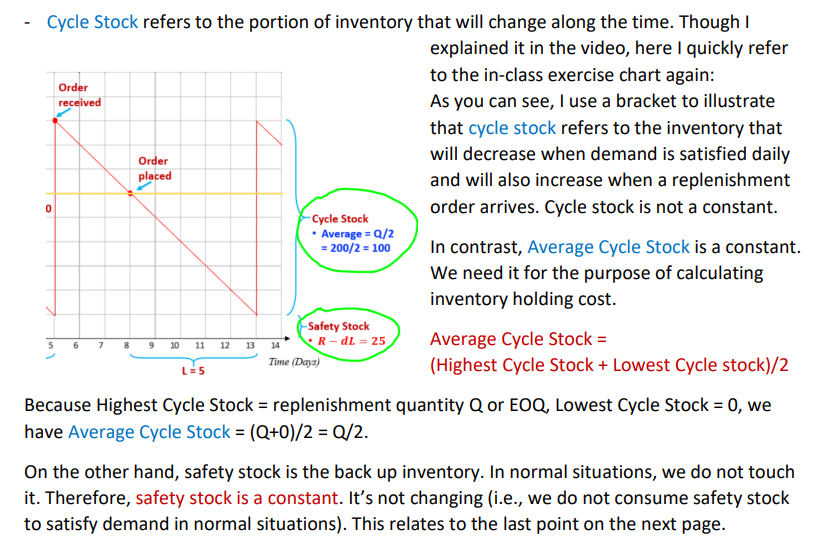
F2023 MGTS 352 (CC91) Case Assignment - Inventory Management (10\%, Total 10 points) The 'Try to Have Just One' (THJO) sunflower seed company roasts and seasons sunflower seeds (in shell). For their production, they require a specific type of oil that they source from a local supplier; the lead time on orders is 3 days. The oil comes in a box that is lined with plastic, with each box of oil costing THJO \$72. Demand averages 100 boxes per day, with a standard deviation of 26 (assume that they run production 365 days/year). Ordering is done by a Procurement Specialist working at THJO and requires checking with the Production Department to see if there are any plans that might cause a sudden change in demand, creating a purchase order (PO), transmitting the purchase order by email and following up with the supplier, and then processing the product receipt and invoice when the product arrives - a recent study by the Procurement department estimates a total administrative cost of $30 per PO (independent of order quantity). The Accounting and Finance Department has requested that a rate of 19% be used when determining holding costs of inventory (this includes cost of capital, insurance, variable storage, and other costs that vary with the amount of inventory on hand). (For the sake of this analysis, ignore seasonality in demand, and any quantity discounts or transportation costs.) Currently, they order Q=500 when inventory reaches R=350 boxes. (5.5 points) Diagram their current ordering policy in a "sawtooth" diagram that clearly labels the order quantity, reorder point, cycle stock, average cycle stock, safety stock and lead time. Start time zero with 450 units on hand (so your first order will be placed at day 1). *Hint - Cycle stock is a changing variable while average cycle stock is a constant. They are two different concepts. * NOTE - Equations and calculations are tangible ways to implement a concept, but note that the concept is important as well - be sure to understand what you are doing and why, and not just how to make the calculation when completing this assignment. Inventory For the sawtooth diagram, you may want to check the following details: - Where is the starting point and where is the inventory position after each day? For example, in In-class Exercise 2 Sawtooth Diagram, the first order is placed at Day 0 . With an average daily demand 25 units, the inventory decreases by 25 units each day. As a result, the inventory position at Day 1 is 15025=125 units. Inventory position at Day 2 is 12525=100 units, etc. As highlighted by the green dots, you read the diagram in the way that the 125 units inventory level (vertical axis) should accurately correspond to the Day 1 label on the horizontal axis. Similarly, the 100 units inventory level should strictly correspond to Day 2. The inventory curve is not drawn randomly. Which point it goes through is determined by the starting point and the average daily demand (i.e., the pace the inventory is consumed). Same thing for the case assignment, your diagram should clearly show the inventory position at each day. - Cycle Stock refers to the portion of inventory that will change along the time. Though I explained it in the video, here I quickly refer to the in-class exercise chart again: As you can see, I use a bracket to illustrate that cycle stock refers to the inventory that will decrease when demand is satisfied daily and will also increase when a replenishment order arrives. Cycle stock is not a constant. In contrast, Average Cycle Stock is a constant. We need it for the purpose of calculating inventory holding cost. Average Cycle Stock = (Highest Cycle Stock + Lowest Cycle stock)/2 Because Highest Cycle Stock = replenishment quantity Q or EOQ, Lowest Cycle Stock =0, we have Average Cycle Stock =(Q+0)/2=Q/2. On the other hand, safety stock is the back up inventory. In normal situations, we do not touch it. Therefore, safety stock is a constant. It's not changing (i.e., we do not consume safety stock to satisfy demand in normal situations). This relates to the last point on the next page. On the sawtooth diagram, you can confirm whether you get the safety stock quantity correct by checking whether the quantity = Reorder point R - daily demand d Lead time L. If you draw the inventory curve correctly, the chart should be consistent with the R-dL calculationStep by Step Solution
There are 3 Steps involved in it
Step: 1

Get Instant Access to Expert-Tailored Solutions
See step-by-step solutions with expert insights and AI powered tools for academic success
Step: 2

Step: 3

Ace Your Homework with AI
Get the answers you need in no time with our AI-driven, step-by-step assistance
Get Started


