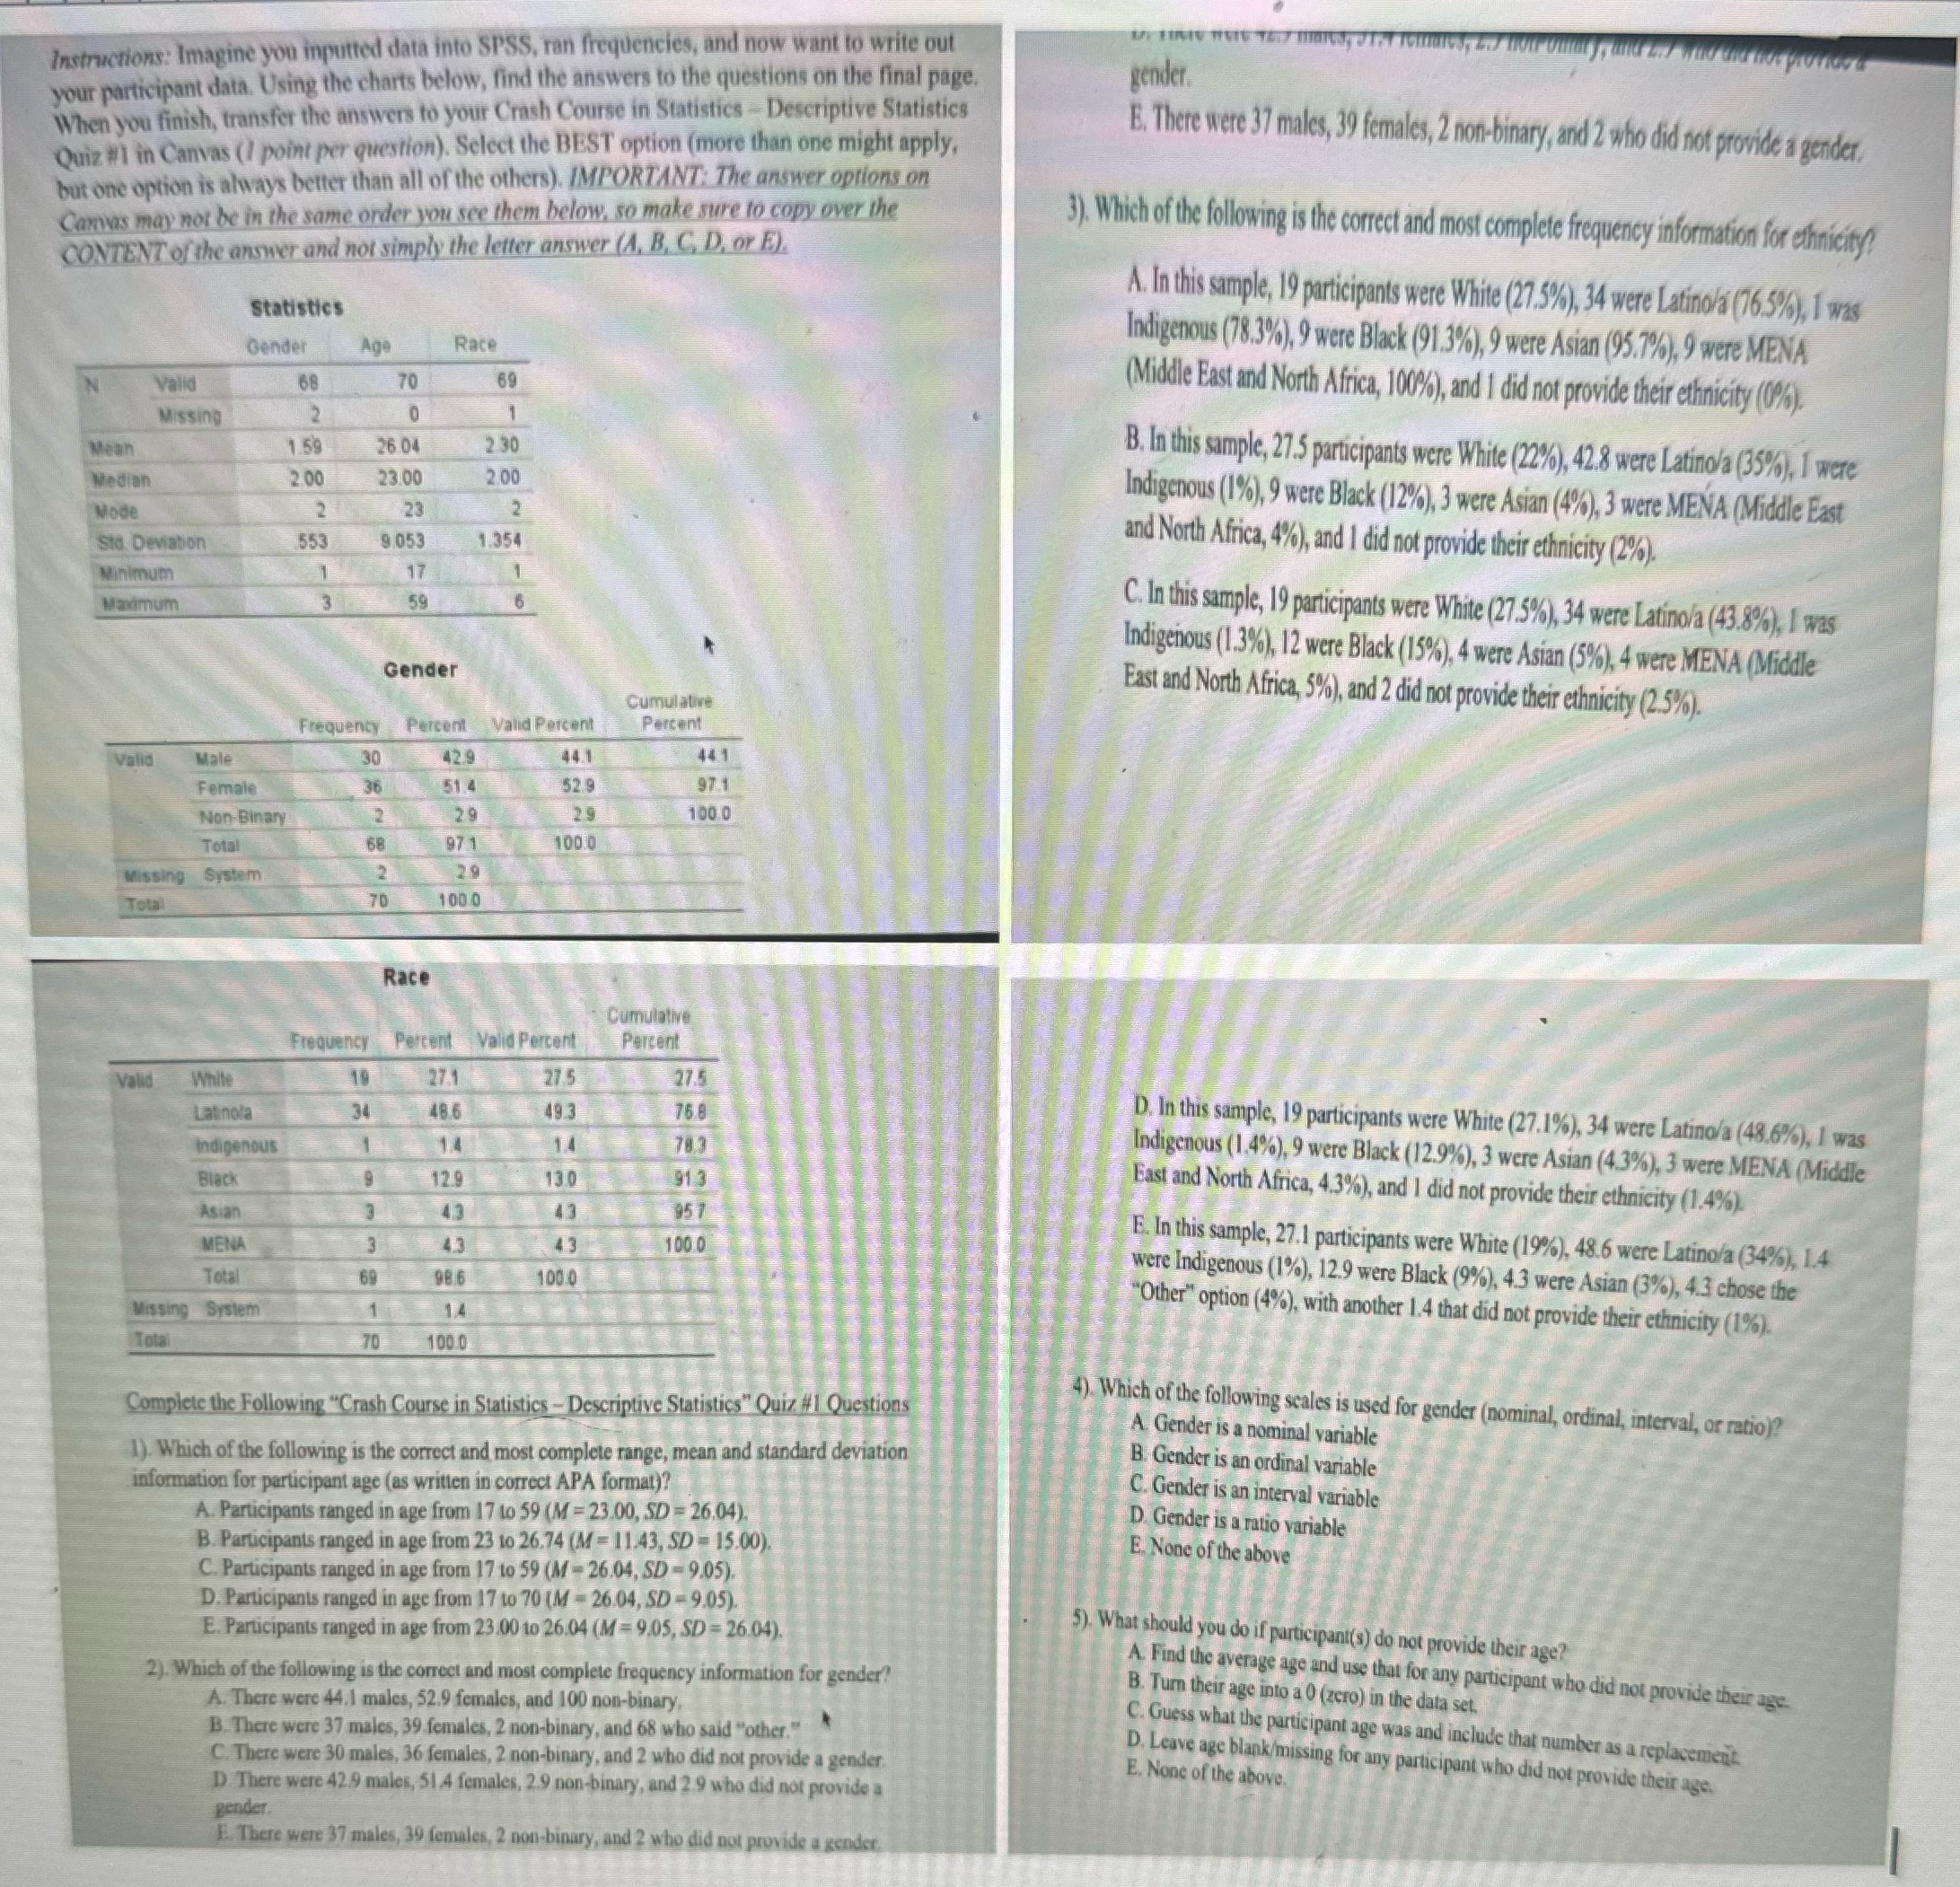
Instructions: Imagine you inputted data into SPSS, ran frequencies, and now want to write out your participant data. Using the charts below, find the answers to the questions on the final page. gender. When you finish, transfer the answers to your Crash Course in Statistics - Descriptive Statistics E. There were 37 males, 39 females, 2 non-binary, and 2 who did not provide a gender. Quiz #1 in Canvas (I point per question). Select the BEST option (more than one might apply, but one option is always better than all of the others). IMPORTANT: The answer options on Canvas may not be in the same order you see them below, so make sure to copy over the 3). Which of the following is the correct and most complete frequency information for ethnicity? CONTENT of the answer and not simply the letter answer (A, B. C.D. or E). A. In this sample, 19 participants were White (27.5%), 34 were Latinola (76.5%), 1 was Statistics Gende Age Race Indigenous (78.3%), 9 were Black (91.3%), 9 were Asian (95.7%), 9 were MENA Valid 68 70 (Middle East and North Africa, 100%), and I did not provide their ethnicity (0%). Missing Mean 159 26 04 230 B. In this sample, 27.5 participants were White (22%), 42.8 were Latino/a (35%), I were Median 2 00 23.00 200 Indigenous (1%), 9 were Black (12%), 3 were Asian (4%), 3 were MENA (Middle East Mode 23 Sto. Deviation 553 9.053 1.354 and North Africa, 4%), and 1 did not provide their ethnicity (2%). Minimum 17 Maximum C. In this sample, 19 participants were White (27.5%), 34 were Latino/a (43.8%), I was Indigenous (1.3%), 12 were Black (15%), 4 were Asian (5%), 4 were MENA (Middle Gender Cumulative East and North Africa, 5%), and 2 did not provide their ethnicity (2.5%). Frequenty Percent Valid Percent Percent Male 30 429 44.1 441 Valid Female 51.4 529 971 Non Binary 29 29 100 0 Total 971 100 0 Missing System 29 Total 100 0 Race Cumulative Frequency Percent Valid Percent Percent Valid White 27.1 27.5 27.5 Latinola 34 486 49 3 758 D. In this sample, 19 participants were White (27.1%), 34 were Latino/a (48.6%), I was Indigenous 14 783 indigenous (1.4%), 9 were Black (12.9%), 3 were Asian (4.3%), 3 were MENA (Middle Black 12.9 13.0 913 East and North Africa, 4.3%), and I did not provide their ethnicity (1.4%). Asian 43 957 E. In this sample, 27.1 participants were White (19%), 48.6 were Latinola (34%), 1.4 MENA 43 100 0 Total 98.6 100 0 were Indigenous (1%), 12.9 were Black (9%), 4.3 were Asian (3%), 4.3 chose the Missing System 14 Other" option (4%), with another 1.4 that did not provide their ethnicity (1%). Total 70 100.0 Complete the Following "Crash Course in Statistics -Descriptive Statistics" Quiz #1 Questions 4). Which of the following scales is used for gender (nominal, ordinal, interval, or ratio)? A Gender is a nominal variable 1). Which of the following is the correct and most complete range, mean and standard deviation B. Gender is an ordinal variable information for participant age (as written in correct APA format)? C. Gender is an interval variable A. Participants ranged in age from 17 to 59 (M = 23.00, SD = 26.04). D. Gender is a ratio variable B. Participants ranged in age from 23 to 26,74 (M = 11.43, SD - 15.00). E. None of the above C. Participants ranged in age from 17 to 59 (M = 26.04, SD - 9.05). D. Participants ranged in age from 17 to 70 (M - 26.04, SD = 9.05). E. Participants ranged in age from 23,00 to 26.04 (M = 9.05, SD = 26.04). 5). What should you do if participant(s) do not provide their age? 2). Which of the following is the correct and most complete frequency information for gender? A. Find the average age and use that for any participant who did not provide their age- A. There were 44,1 males, 52.9 females, and 100 non-binary, B. Turn their age into a O (zero) in the data set. B. There were 37 males, 39 females, 2 non-binary, and 68 who said "other." C. Guess what the participant age was and include that number as a replacement. C. There were 30 males, 36 females, 2 non-binary, and 2 who did not provide a gender. D. Leave age blank/missing for any participant who did not provide their age. E. None of the above. D. There were 42.9 males, 51 4 females, 2.9 non-binary, and 2.9 who did not provide a gender E. There were 37 males, 39 females, 2 non-binary, and 2 who did not provide a gender