Answered step by step
Verified Expert Solution
Question
1 Approved Answer
Instructions Instructions Analytics starts with data. Identifying, accessing, obtaining, and processing of relevant data is the most essential task in any analytics study. As a
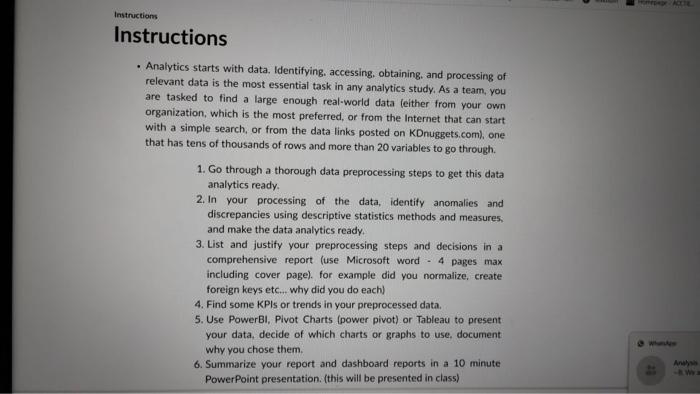
Instructions Instructions Analytics starts with data. Identifying, accessing, obtaining, and processing of relevant data is the most essential task in any analytics study. As a team, you are tasked to find a large enough real-world data (either from your own organization, which is the most preferred, or from the Internet that can start with a simple search, or from the data links posted on KDnuggets.com), one that has tens of thousands of rows and more than 20 variables to go through. 1. Go through a thorough data preprocessing steps to get this data analytics ready. 2. In your processing of the data, identify anomalies and discrepancies using descriptive statistics methods and measures, and make the data analytics ready. 3. List and justify your preprocessing steps and decisions in a comprehensive report (use Microsoft word - 4 pages max including cover page). for example did you normalize, create foreign keys etc... why did you do each) 4. Find some KPIs or trends in your preprocessed data. 5. Use PowerBI, Pivot Charts (power pivot) or Tableau to present your data, decide of which charts or graphs to use, document why you chose them. 6. Summarize your report and dashboard reports in a 10 minute PowerPoint presentation. (this will be presented in class) Homepage - ACCT8... WhatsApp Analysis -B: We a

Step by Step Solution
There are 3 Steps involved in it
Step: 1

Get Instant Access to Expert-Tailored Solutions
See step-by-step solutions with expert insights and AI powered tools for academic success
Step: 2

Step: 3

Ace Your Homework with AI
Get the answers you need in no time with our AI-driven, step-by-step assistance
Get Started


