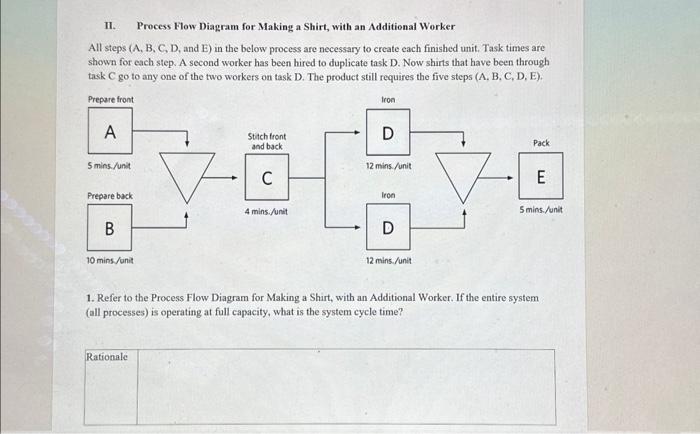
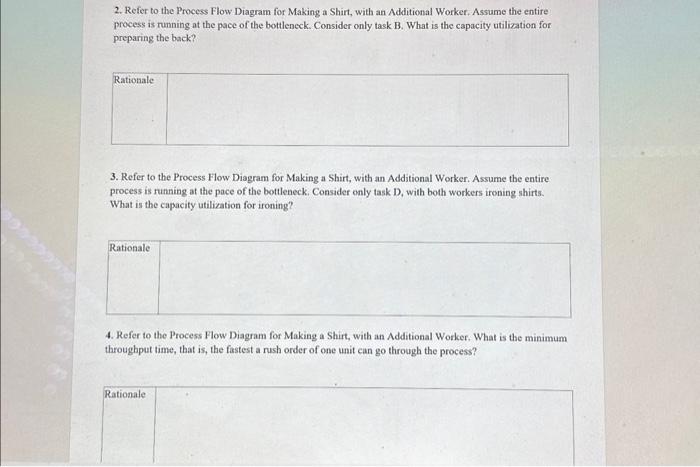
INSTRUCTIONS NOTE: To make your calculations as straightforward as possible in the following exercises, assume unless stated otherwise that: - There are sufficient parts or raw materials, so tasks are never starved. - Task times have negligible variability and, over time, workers neither speed up nor slow down. - There are no machine breakdowns or maintenance. - When there are buffers shown in process flow diagrams, they are large enough to accommodate any amount of work in process (WIP). - Travel time and time to transport parts from one operation to another are negligible. - All operations run with 100% yield; that is, the operations produce no defective units. - All processes are in steady state; thus, you may ignore any startup effects. 2. Refer to the Process Flow Diagram for Making a Shirt, with an Additional Worker. Assume the entire process is running at the pace of the bottleneck. Consider only task B. What is the capacity utilization for preparing the back? 3. Refer to the Process Flow Diagram for Making a Shirt, with an Additional Worker. Assume the entire process is running at the pace of the bottleneck. Consider only task D, with both workers ironing shirts. What is the capacity utilization for ironing? 4. Refer to the Process Flow Diagram for Making a Shirt, with an Additional Worker. What is the minimum throughput time, that is, the fastest a rush order of one unit can go through the process? II. Process Flow Diagram for Making a Shirt, with an Additional Worker All steps (A, B, C, D, and E) in the below process are necessary to create each finished unit. Task times are shown for each step. A second worker has been hired to duplicate task D. Now shirts that have been through task C go to any one of the two workers on task D. The product still requires the five steps (A, B, C, D, E). 1. Refer to the Process Flow Diagram for Making a Shirt, with an Additional Worker. If the entire system (all processes) is operating at full capacity, what is the system cycle time