
| Instructions: |
| Please answer the following questions for Target : |
| | | | | | | | | | | | |
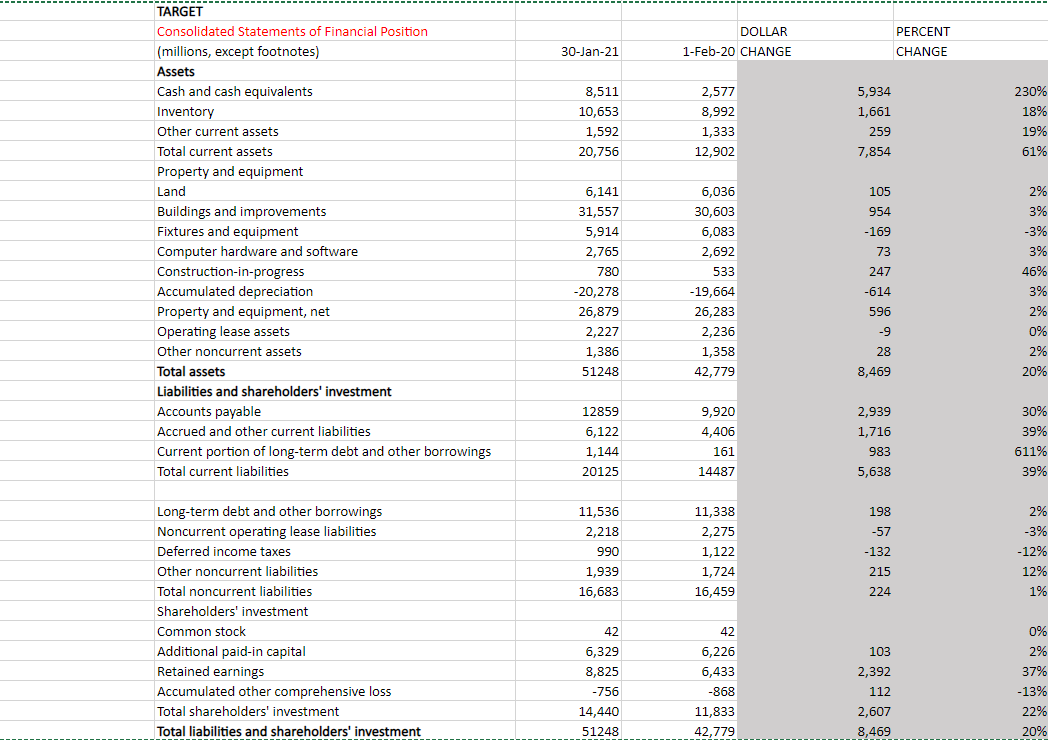
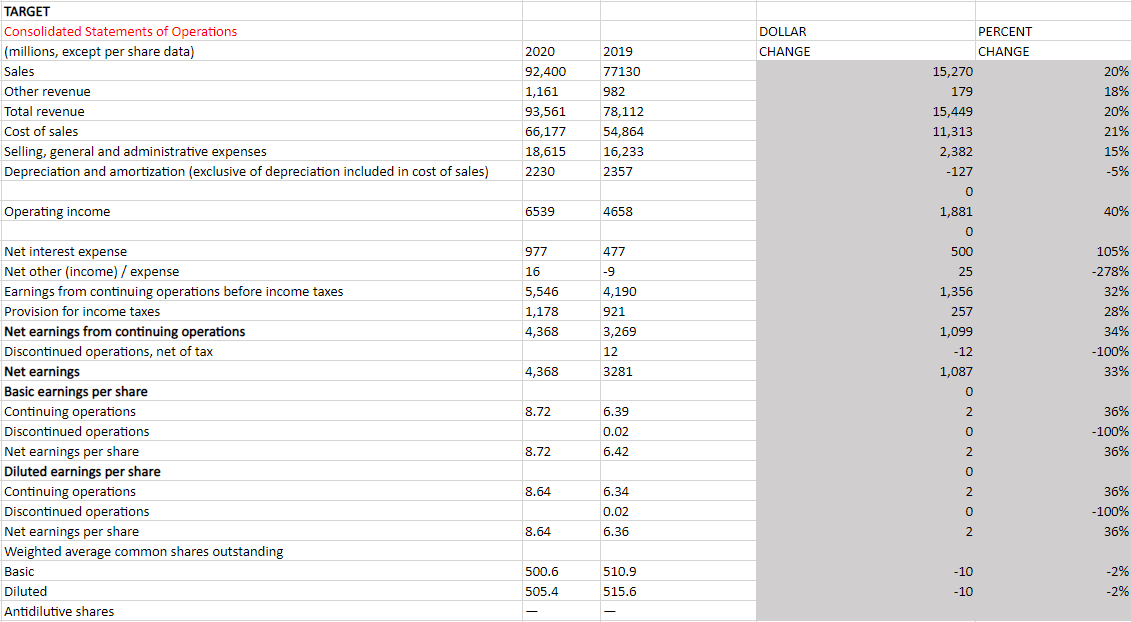
| Name two accounts that increased. |
| |
| |
| |
| Name two accounts that decreased. |
| |
| |
| |
| Explain why you think the above mentioned accounts increased/decreased. (There is no right or wrong answer for this area. I want you to use the knowledge you learned to analyze the increase/decrease) |
| |
| |
| |
| |
| |
| |
| How does the horizontal analysis impact a potential investor? Would this encourage them to invest or not? Why? |
| |
| |
| |
| |
| |
DOLLAR 1-Feb-20 CHANGE PERCENT CHANGE 30-Jan-21 8,511 10,653 1,592 20,756 2,577 8,992 1,333 12,902 5,934 1,661 259 7,854 230% 18% 19% 61% 105 954 TARGET Consolidated Statements of Financial Position (millions, except footnotes) Assets Cash and cash equivalents Inventory Other current assets Total current assets Property and equipment Land Buildings and improvements Fixtures and equipment Computer hardware and software Construction-in-progress Accumulated depreciation Property and equipment, net Operating lease assets Other noncurrent assets Total assets Liabilities and shareholders' investment Accounts payable Accrued and other current liabilities Current portion of long-term debt and other borrowings Total current liabilities 6,036 30,603 6,083 2,692 -169 73 247 533 6,141 31,557 5,914 2,765 780 -20,278 26,879 2,227 1,386 51248 2% 3% -3% 3% 46% 3% 2% 0% 2% 20% -614 596 -19,664 26,283 2,236 1,358 42,779 -9 28 8,469 12859 6,122 1,144 20125 9,920 4,406 161 14487 2,939 1,716 983 5,638 30% 39% 611% 39% 11,536 2,218 990 1,939 16,683 11,338 2,275 1,122 1,724 16,459 198 -57 -132 215 224 2% -3% -12% 12% 1% Long-term debt and other borrowings Noncurrent operating lease liabilities Deferred income taxes Other noncurrent liabilities Total noncurrent liabilities Shareholders' investment ' Common stock Additional paid-in capital Retained earnings Accumulated other comprehensive loss Total shareholders' investment Total liabilities and shareholders' investment 42 103 6,329 8,825 -756 14,440 51248 42 6,226 6,433 -868 11,833 42,779 2,392 112 2,607 8,469 0% 2% 37% -13% 22% 20% DOLLAR 2019 CHANGE TARGET Consolidated Statements of Operations (millions, except per share data) Sales Other revenue Total revenue Cost of sales Selling, general and administrative expenses Depreciation and amortization (exclusive of depreciation included in cost of sales) 2020 92,400 1,161 93,561 66,177 18,615 2230 77130 982 78,112 54,864 16,233 2357 20% 18% 20% 21% 15% -5% PERCENT CHANGE 15,270 179 15,449 11,313 2,382 -127 0 0 1,881 0 0 500 25 1,356 257 1,099 -12 1,087 Operating income 6539 4658 40% 477 977 16 5,546 1,178 4,368 -9 4,190 921 105% -278% 32% 28% 34% - 100% 33% 3,269 12 4,368 3281 0 8.72 2 Net interest expense Net other (income) / expense Earnings from continuing operations before income taxes Provision for income taxes Net earnings from continuing operations Discontinued operations, net of tax Net earnings Basic earnings per share Continuing operations Discontinued operations Net earnings per share Diluted earnings per share Continuing operations Discontinued operations Net earnings per share Weighted average common shares outstanding Basic Diluted Antidilutive shares 6.39 0.02 6.42 o 36% -100% 36% 8.72 2 0 2 8.64 6.34 0.02 0 36% -100% 36% 8.64 6.36 2 510.9 500.6 505.4 -10 -10 -2% -2% 515.6


