Answered step by step
Verified Expert Solution
Link Copied!

Question

1 Approved Answer

Instructions SHOW ALL WORK. Include either step-by-step computations or excel formulas to show how you obtained your answer. Introduction Partial credit is available if the
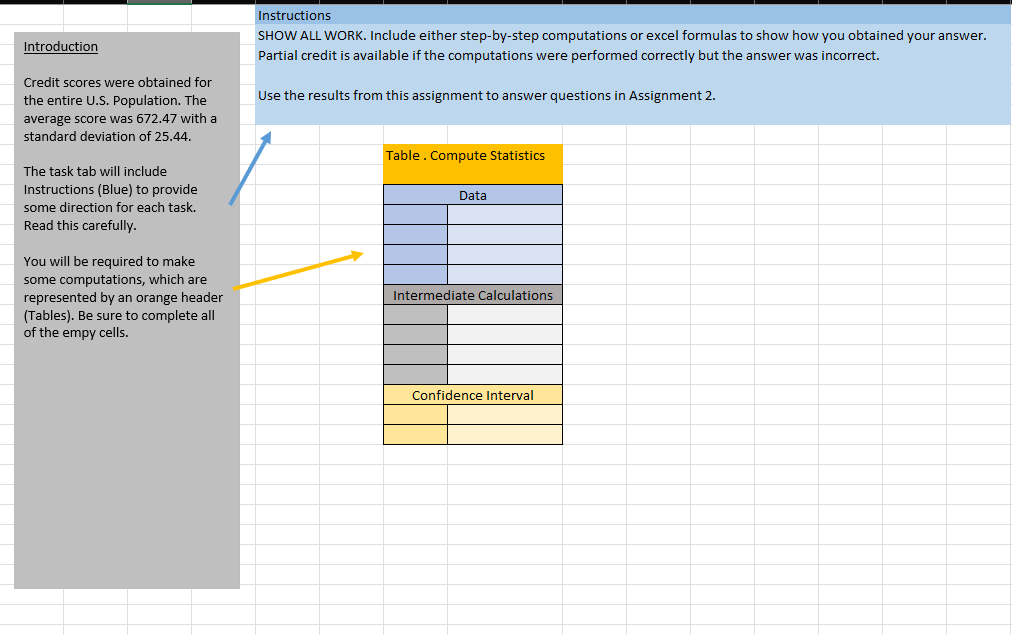
image text in transcribed
Instructions SHOW ALL WORK. Include either step-by-step computations or excel formulas to show how you obtained your answer. Introduction Partial credit is available if the computations were performed correctly but the answer was incorrect. Credit scores were obtained for the entire U.S. Population. The Use the results from this assignment to answer questions in Assignment 2. average score was 672.47 with a standard deviation of 25.44. Table . Compute Statistics The task tab will include Instructions (Blue) to provide Data some direction for each task. Read this carefully. You will be required to make some computations, which are represented by an orange header Intermediate Calculations (Tables). Be sure to complete all of the empy cells. Confidence Interval

Step by Step Solution

There are 3 Steps involved in it

Step: 1

blur-text-image

Get Instant Access to Expert-Tailored Solutions

See step-by-step solutions with expert insights and AI powered tools for academic success

Step: 2

blur-text-image

Step: 3

blur-text-image

Ace Your Homework with AI

Get the answers you need in no time with our AI-driven, step-by-step assistance

Get Started

Recommended Textbook for

Intro Stats

Authors: Richard D. De Veaux, Paul F. Velleman, David E. Bock

3rd edition

321533283, 321533289, 9780321463708, 9780321503848, 9780321503800, 9780321499431, 9780321499417, 978-0321500458

More Books

Students also viewed these Mathematics questions

Question

3. Is it consistent with the organizations values?

Answered: 1 week ago