

Answered step by step
Verified Expert Solution
Question
1 Approved Answer
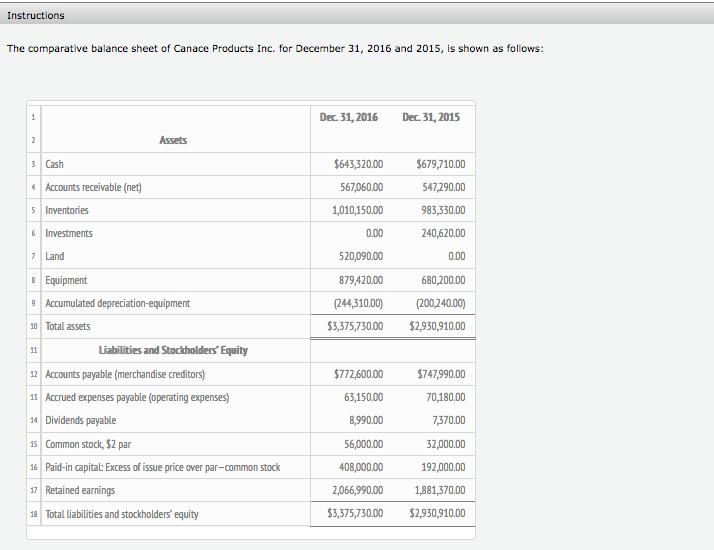
Instructions The comparative balance sheet of Canace Products Inc. for December 31, 2016 and 2015, is shown as follows: Dec 2016 Dec 31, 2015 3
Step by Step Solution
There are 3 Steps involved in it
Step: 1

Get Instant Access to Expert-Tailored Solutions
See step-by-step solutions with expert insights and AI powered tools for academic success
Step: 2

Step: 3
Ace Your Homework with AI
Get the answers you need in no time with our AI-driven, step-by-step assistance
Get Started
Performance Auditing
Authors: Shrivastava A.
1st Edition
8131316254, 978-8131316252