

Answered step by step
Verified Expert Solution
Question
1 Approved Answer
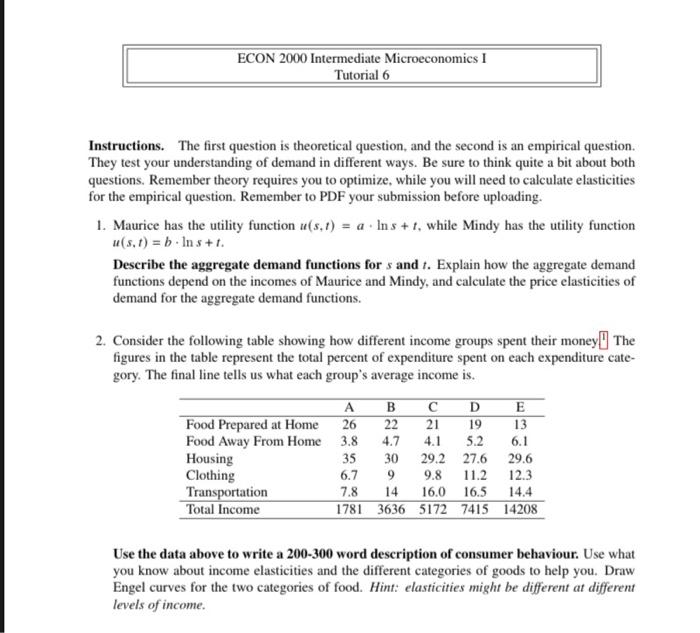
Instructions. The first question is theoretical question, and the second is an empirical question. They test your understanding of demand in different ways. Be sure
Step by Step Solution
There are 3 Steps involved in it
Step: 1

Get Instant Access to Expert-Tailored Solutions
See step-by-step solutions with expert insights and AI powered tools for academic success
Step: 2

Step: 3
Ace Your Homework with AI
Get the answers you need in no time with our AI-driven, step-by-step assistance
Get Started
ACCOUNTING JOB QUESTIONS AND ANSWERS Trainee Accountants Handbook
Authors: Sterling Libs FCCA
1st Edition
1911037129, 978-1911037125