Answered step by step
Verified Expert Solution
Question
1 Approved Answer
Exhibit 1.1a: Calculation of number of encounters by Payor ty Total Enounters Baseline Year Projected growth from a major HMO Projected growth from Medicare

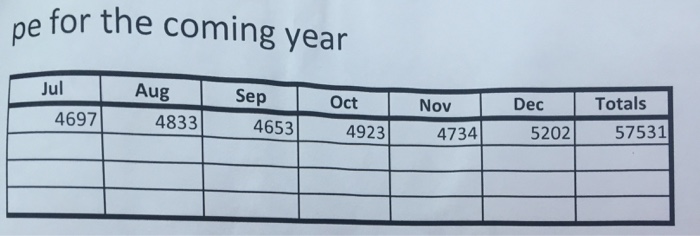
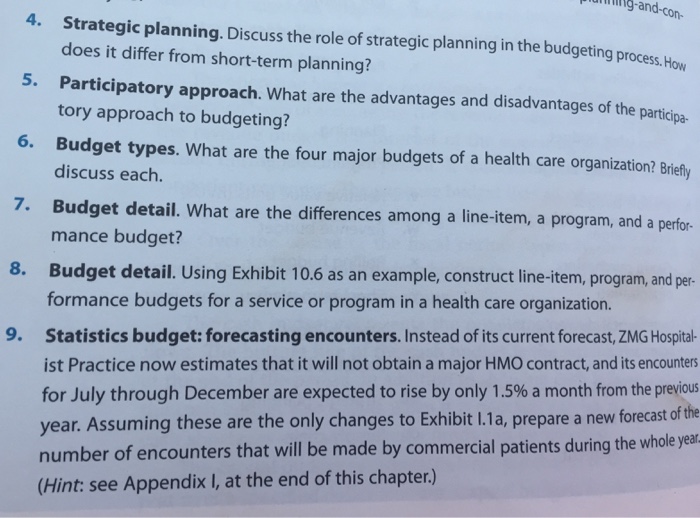
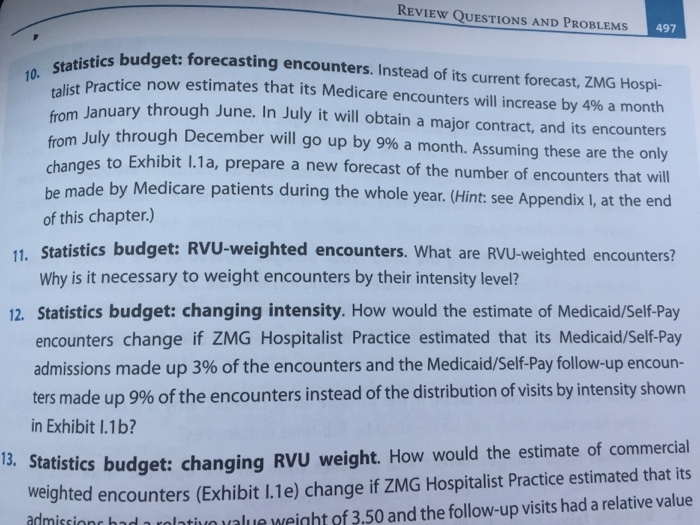
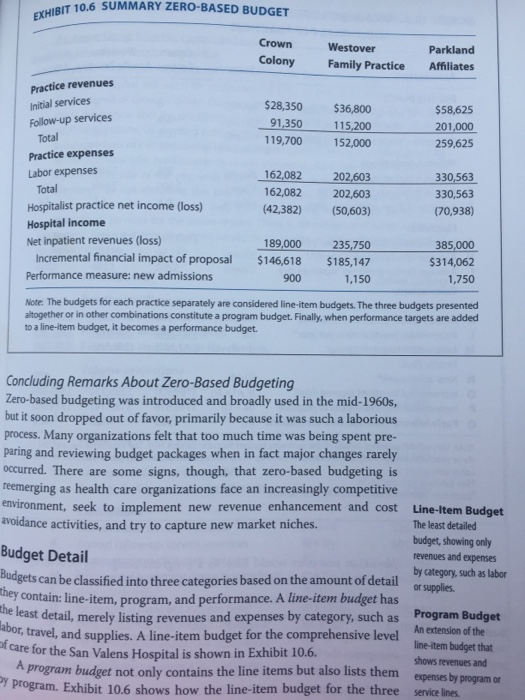
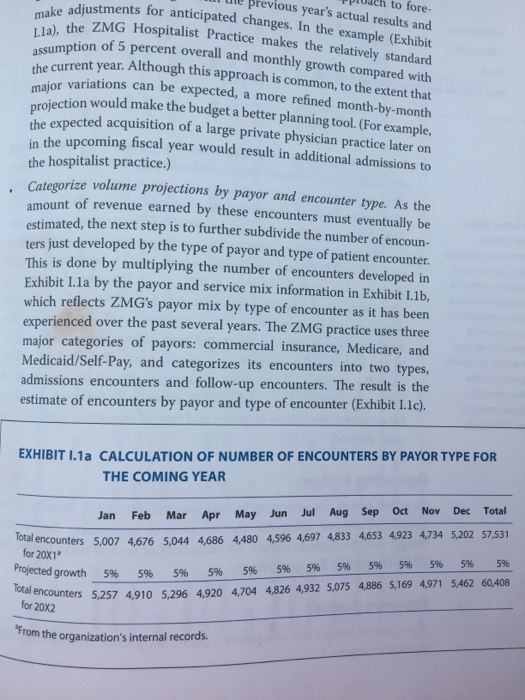
Exhibit 1.1a: Calculation of number of encounters by Payor ty Total Enounters Baseline Year Projected growth from a major HMO Projected growth from Medicare Total Visit Growth Jan 5007 Feb 4676 Mar 5044 Apr 4686 May 4480 Jun 4596 pe for the coming year Jul 4697 Aug 4833 Sep 4653 Oct 4923 Nov 4734 Dec 5202 Totals 57531 and-con- 4. Strategic planning. Discuss the role of strategic planning in the budgeting process. How does it differ from short-term planning? 5. Participatory approach. What are the advantages and disadvantages of the participa- tory approach to budgeting? Budget types. What are the four major budgets of a health care organization? Briefly discuss each. 6. 7. Budget detail. What are the differences among a line-item, a program, and a perfor- mance budget? 8. Budget detail. Using Exhibit 10.6 as an example, construct line-item, program, and per- formance budgets for a service or program in a health care organization. 9. Statistics budget: forecasting encounters. Instead of its current forecast, ZMG Hospital- ist Practice now estimates that it will not obtain a major HMO contract, and its encounters for July through December are expected to rise by only 1.5% a month from the previous year. Assuming these are the only changes to Exhibit 1.1a, prepare a new forecast of the number of encounters that will be made by commercial patients during the whole year (Hint: see Appendix I, at the end of this chapter.) REVIEW QUESTIONS AND PROBLEMS 497 10. Statistics budget: forecasting encounters. Instead of its current forecast, ZMG Hospi- talist Practice now estimates that its Medicare encounters will increase by 4% a month from January through June. In July it will obtain a major contract, and its encounters from July through December will go up by 9% a month. Assuming these are the only changes to Exhibit 1.1a, prepare a new forecast of the number of encounters that will be made by Medicare patients during the whole year. (Hint: see Appendix I, at the end of this chapter.) 11. Statistics budget: RVU-weighted encounters. What are RVU-weighted encounters? Why is it necessary to weight encounters by their intensity level? 12. Statistics budget: changing intensity. How would the estimate of Medicaid/Self-Pay encounters change if ZMG Hospitalist Practice estimated that its Medicaid/Self-Pay admissions made up 3% of the encounters and the Medicaid/Self-Pay follow-up encoun- ters made up 9% of the encounters instead of the distribution of visits by intensity shown in Exhibit l.1b? 13. Statistics budget: changing RVU weight. How would the estimate of commercial weighted encounters (Exhibit 1.1e) change if ZMG Hospitalist Practice estimated that its admissions had a relativo value weight of 3.50 and the follow-up visits had a relative value EXHIBIT 10.6 SUMMARY ZERO-BASED BUDGET Practice revenues Initial services Follow-up services Total Practice expenses Labor expenses Total Hospitalist practice net income (loss) Hospital income Net inpatient revenues (loss) Incremental financial impact of proposal Performance measure: new admissions Crown Colony $28,350 91,350 119,700 Westover Family Practice 189,000 $146,618 900 $36,800 115,200 152,000 162,082 202,603 162,082 202,603 (42,382) (50,603) 235,750 $185,147 1,150 Concluding Remarks About Zero-Based Budgeting Zero-based budgeting was introduced and broadly used in the mid-1960s, but it soon dropped out of favor, primarily because it was such a laborious process. Many organizations felt that too much time was being spent pre- paring and reviewing budget packages when in fact major changes rarely occurred. There are some signs, though, that zero-based budgeting is reemerging as health care organizations face an increasingly competitive environment, seek to implement new revenue enhancement and cost avoidance activities, and try to capture new market niches. Parkland Affiliates Budget Detail Budgets can be classified into three categories based on the amount of detail they contain: line-item, program, and performance. A line-item budget has the least detail, merely listing revenues and expenses by category, such as abor, travel, and supplies. A line-item budget for the comprehensive level of care for the San Valens Hospital is shown in Exhibit 10.6. $58,625 201,000 259,625 330,563 330,563 (70,938) Note: The budgets for each practice separately are considered line-item budgets. The three budgets presented altogether or in other combinations constitute a program budget. Finally, when performance targets are added to a line-item budget, it becomes a performance budget. 385,000 $314,062 1,750 Line-Item Budget The least detailed budget, showing only revenues and expenses by category, such as labor or supplies. Program Budget An extension of the line-item budget that shows revenues and expenses by program or A program budget not only contains the line items but also lists them Dy program. Exhibit 10.6 shows how the line-item budget for the three service lines. . to fore- previous year's actual results and make adjustments for anticipated changes. In the example (Exhibit Ila), the ZMG Hospitalist Practice makes the relatively standard assumption of 5 percent overall and monthly growth compared with the current year. Although this approach is common, to the extent that major variations can be expected, a more refined month-by-month projection would make the budget a better planning tool. (For example, the expected acquisition of a large private physician practice later on in the upcoming fiscal year would result in additional admissions to the hospitalist practice.) Categorize volume projections by payor and encounter type. As the amount of revenue earned by these encounters must eventually be estimated, the next step is to further subdivide the number of encoun- ters just developed by the type of payor and type of patient encounter. This is done by multiplying the number of encounters developed in Exhibit 1.1a by the payor and service mix information in Exhibit 1.1b, which reflects ZMG's payor mix by type of encounter as it has been experienced over the past several years. The ZMG practice uses three major categories of payors: commercial insurance, Medicare, and Medicaid/Self-Pay, and categorizes its encounters into two types, admissions encounters and follow-up encounters. The result is the estimate of encounters by payor and type of encounter (Exhibit I.1c). EXHIBIT I.1a CALCULATION OF NUMBER OF ENCOUNTERS BY PAYOR TYPE FOR THE COMING YEAR Oct Jul Dec Nov Aug Sep Total Jan Mar Apr May Jun Feb Total encounters 5,007 4,676 5,044 4,686 4,480 4,596 4,697 4,833 4,653 4,923 4,734 5,202 57,531 for 20X1 5% 5% Projected growth Total encounters 5,257 4,910 5,296 4,920 4,704 4,826 4,932 5,075 4,886 5,169 4,971 5,462 60,408 for 20X2 5% 5% 5% 5% 5% 5% "From the organization's internal records. 5% 5% 5% 5% 5%
Step by Step Solution
★★★★★
3.37 Rating (156 Votes )
There are 3 Steps involved in it
Step: 1

Get Instant Access to Expert-Tailored Solutions
See step-by-step solutions with expert insights and AI powered tools for academic success
Step: 2

Step: 3

Ace Your Homework with AI
Get the answers you need in no time with our AI-driven, step-by-step assistance
Get Started


