

Question
INSTRUCTIONS This assignment testsyour ability to create a simple regression solution to a prediction problem. You will use a dataset of bike rentals fromCapital Bikeshare
INSTRUCTIONS
This assignment testsyour ability to create a simple regression solution to a prediction problem. You will use a dataset of bike rentals fromCapital Bikeshare system, Washington D.C., USA which ispublicly available athttp://capitalbikeshare.com/system-data.You will do a regression that will predict the number of bike rentals on a particular day given the weather conditions.
There are two questions in this assignment and one optional True and False section.
The file bikeshare_data.csvin Vocareum contains an extract of the data downloaded from link provided in the description.
About the data
In any machine learning problem, it is very interesting to get a feel of the data in its entirety. Although we might not be using all the columns in the data provided, it is generally a good practice to know what the different columns are because understanding data is the key. The data consists of the following fields:
- instant: record index
- dteday : date
- season : season (1:spring, 2:summer, 3:fall, 4:winter)
- yr : year (0: 2011, 1:2012)
- mnth : month ( 1 to 12)
- hr : hour (0 to 23)
- holiday : whether the day is a holiday or not (extracted from http://dchr.dc.gov/page/holiday-schedule)
- weekday : day of the week
- workingday : if the day is neither weekend nor holiday-1, otherwise is 0.
+ weathersit :
- 1: Clear, Few clouds, Partly cloudy, Partly cloudy
- 2: Mist + Cloudy, Mist + Broken clouds, Mist + Few clouds, Mist
- 3: Light Snow, Light Rain + Thunderstorm + Scattered clouds, Light Rain + Scattered clouds
- 4: Heavy Rain + Ice Pallets + Thunderstorm + Mist, Snow + Fog
- temp : Normalized temperature in Celsius. The values are divided into 41 (max)
- atemp: Normalized feeling temperature in Celsius. The values are divided into 50 (max)
- hum: Normalized humidity. The values are divided into 100 (max)
- windspeed: Normalized wind speed. The values are divided into 67 (max)
- casual: count of casual users
- registered: count of registered users
- cnt: count of total rental bikes including both casual and registered
Goal: use this data to do a regression analysis that focuses on predicting the number of bike rentals for a particular day.
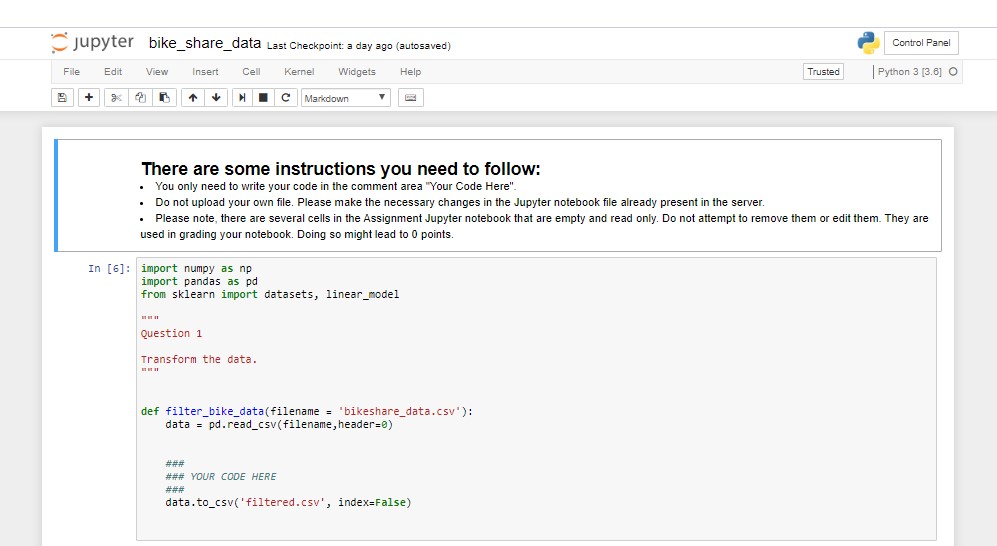
Question 1: Preprocessing
In this question, you will prepare the data before building your regression model. After preparing the data, you will save it as a CSV.
Follow these steps to prepare the data:
- Read the data with the pandas read_csv function
- Let us see how many rows and columns the data has for the sanity check. The total should be 17379 rows and 17 columns.
- Our objective here is to cleanse this data.We aim to do a linear regression analysis on the data only for working days between 9 AM to 6 PM. This means that we will have to remove some rows which are not of our interest. The following steps would demonstrate what we need to do.
- Let us first remove all the data for the holidays. This would mean removing all the rows where the holidayfield is one. Let us first see how many such rows are there.There should be 500 such rows. Now remove them.
- Now, let us remove all the days which were not a working day. This would mean removing all the rows where the 'workingday' field is 0. There should be 5014 such rows. Remove all of them.
- Now, we would take only the data for times 9 AM to 6 PM. This would mean that we only need to take the rows where the value of the 'hr' column is between [9,17] as 17 depicts the time frame 5 PM to 6 PM. Remove all the rows that do not satisfy this condition. You should get 4477 rows.
- Since we want to see the impact of weather conditions on the number of booking, create a subset of this data now that contains temp, hum, windspeed, and cnt.
- Save this subset of data as a CSV called 'filtered.csv'. The output should look something like that (don't forget the header):
temp,hum,windspeed,cnt
0.16,0.43,0.3881,88
0.18,0.43,0.2537,44
0.20,0.40,0.3284,51
0.22,0.35,0.2985,61
WARNING: Do not change the order of the rows. If you do, the grader won't recognize the data and you will get a low grade.
HINT: The file 'filtered.csv' should have4478 rows, counting the header.
Step by Step Solution
There are 3 Steps involved in it
Step: 1

Get Instant Access to Expert-Tailored Solutions
See step-by-step solutions with expert insights and AI powered tools for academic success
Step: 2

Step: 3
Ace Your Homework with AI
Get the answers you need in no time with our AI-driven, step-by-step assistance
Get Started
Financial management theory and practice
Authors: Eugene F. Brigham and Michael C. Ehrhardt
12th Edition
978-0030243998, 30243998, 324422695, 978-0324422696