

Question
Instructions Use MS Excel or Google Sheets to complete the computational questions. Use the data provided in airquality .xlsxto complete the following tasks. The dataset
Instructions
Use MS Excel or Google Sheets to complete the computational questions.
Use the data provided in airquality .xlsxto complete the following tasks.
The dataset contains daily air quality measurements in New York, May to September 1973. More about the variables can be found here https://www.rdocumentation.org/packages/datasets/versions/3.6.2/topics/airquality
- Watch the one of following videos to add the data analysis add-in toolpak to Excel:
https://www.youtube.com/watch?v=_yNxLFagKgw
https://www.youtube.com/watch?v=B60rozw34Sc
- Using the Data Analysis tool in Excel, provide descriptive statistics for the four numerical variables of ozone, temp, wind, and solar.
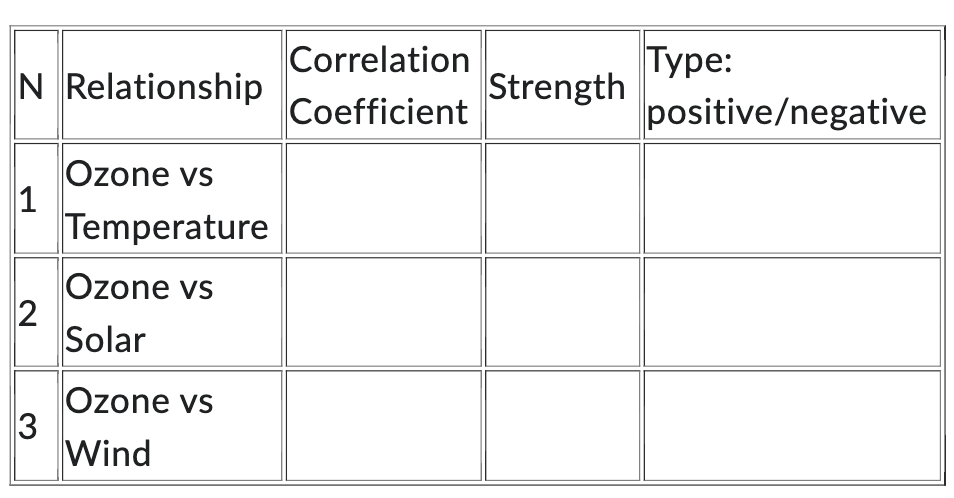
- Using the Data Analysis tool in Excel, calculate the pairwise correlation between the four variables of ozone, temp, wind, and solar. Provide this correlation matrix.
- Use the following scale to interpret the results.
Re-arrange your correlation coefficients in the following table to fill in the blanks:
Step by Step Solution
There are 3 Steps involved in it
Step: 1

Get Instant Access to Expert-Tailored Solutions
See step-by-step solutions with expert insights and AI powered tools for academic success
Step: 2

Step: 3
Ace Your Homework with AI
Get the answers you need in no time with our AI-driven, step-by-step assistance
Get Started
A First Course in General Relativity
Authors: Bernard Schutz
2nd edition
521887054, 978-0521887052