

Answered step by step
Verified Expert Solution
Question
1 Approved Answer
INSTRUCTIONS Use the following information to answer the questions on page 2 below: (note: all sales are credit sales) $ 2019 1.100.000 450.000 650,000 2020
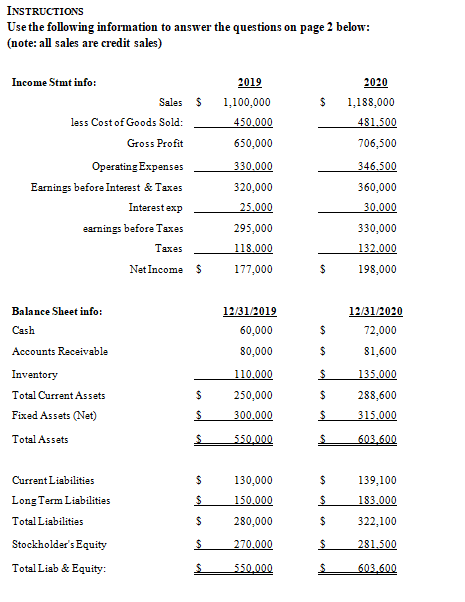 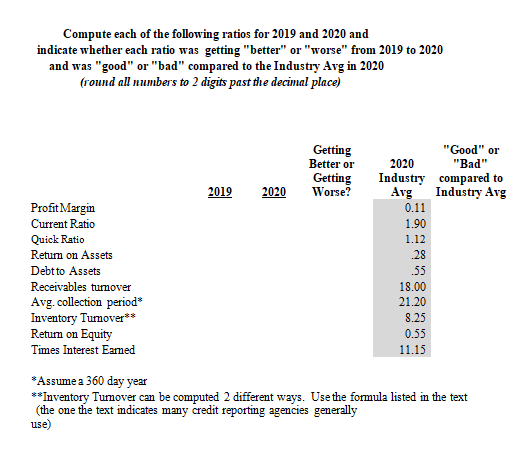 | ||
INSTRUCTIONS Use the following information to answer the questions on page 2 below: (note: all sales are credit sales) $ 2019 1.100.000 450.000 650,000 2020 1,188,000 481.500 706,500 Income Stmt info: Sales $ less Cost of Goods Sold: Gross Profit Operating Expenses Earnings before Interest & Taxes Interestexp earnings before Taxes Taxes 330.000 346.500 320,000 25.000 295,000 360,000 30.000 330.000 132.000 198,000 118.000 Net Income $ 177,000 $ 12/31/2019 60.000 80,000 $ $ Balance Sheet info: Cash Accounts Receivable Inventory Total Current Assets Fixed Assets (Net) 12/31/2020 72,000 81,600 135.000 288,600 315.000 110.000 $ 250,000 $ $ 300.000 $ Total Assets S 550.000 603.600 $ $ 130,000 150.000 Current Liabilities Long Term Liabilities Total Liabilities Stockholder's Equity Total Liab & Equity $ $ 139,100 183.000 322,100 281.500 280,000 $ $ 270.000 $ S 550.000 S 603.600 Compute each of the following ratios for 2019 and 2020 and indicate whether each ratio was getting "better" or "worse" from 2019 to 2020 and was "good" or "bad" compared to the Industry Avg in 2020 (round all numbers to 2 digits past the decimal place) Getting Better or Getting Worse? 2019 2020 Profit Margin Current Ratio Quick Ratio Retum on Assets Debt to Assets Receivables turnover Avg. collection period Inventory Tumover** Retum on Equity Times Interest Earned "Good" or 2020 "Bad" Industry compared to Avg Industry Avg 0.11 1.90 1.12 .28 .55 18.00 21.20 8.25 0.55 11.15 *Assume a 360 day year **Inventory Tumover can be computed 2 different ways. Use the formula listed in the text (the one the text indicates many credit reporting agencies generally use)
Step by Step Solution
There are 3 Steps involved in it
Step: 1

Get Instant Access to Expert-Tailored Solutions
See step-by-step solutions with expert insights and AI powered tools for academic success
Step: 2

Step: 3
Ace Your Homework with AI
Get the answers you need in no time with our AI-driven, step-by-step assistance
Get Started
Portfolio Performance Measurement And Benchmarking
Authors: Jon Christopherson, David Carino, Wayne Ferson
1st Edition
0071496653, 978-0071496650