Question: Instructions: Using Python and the data set provided, I want you to provide me the code and output that completes the following. That said,

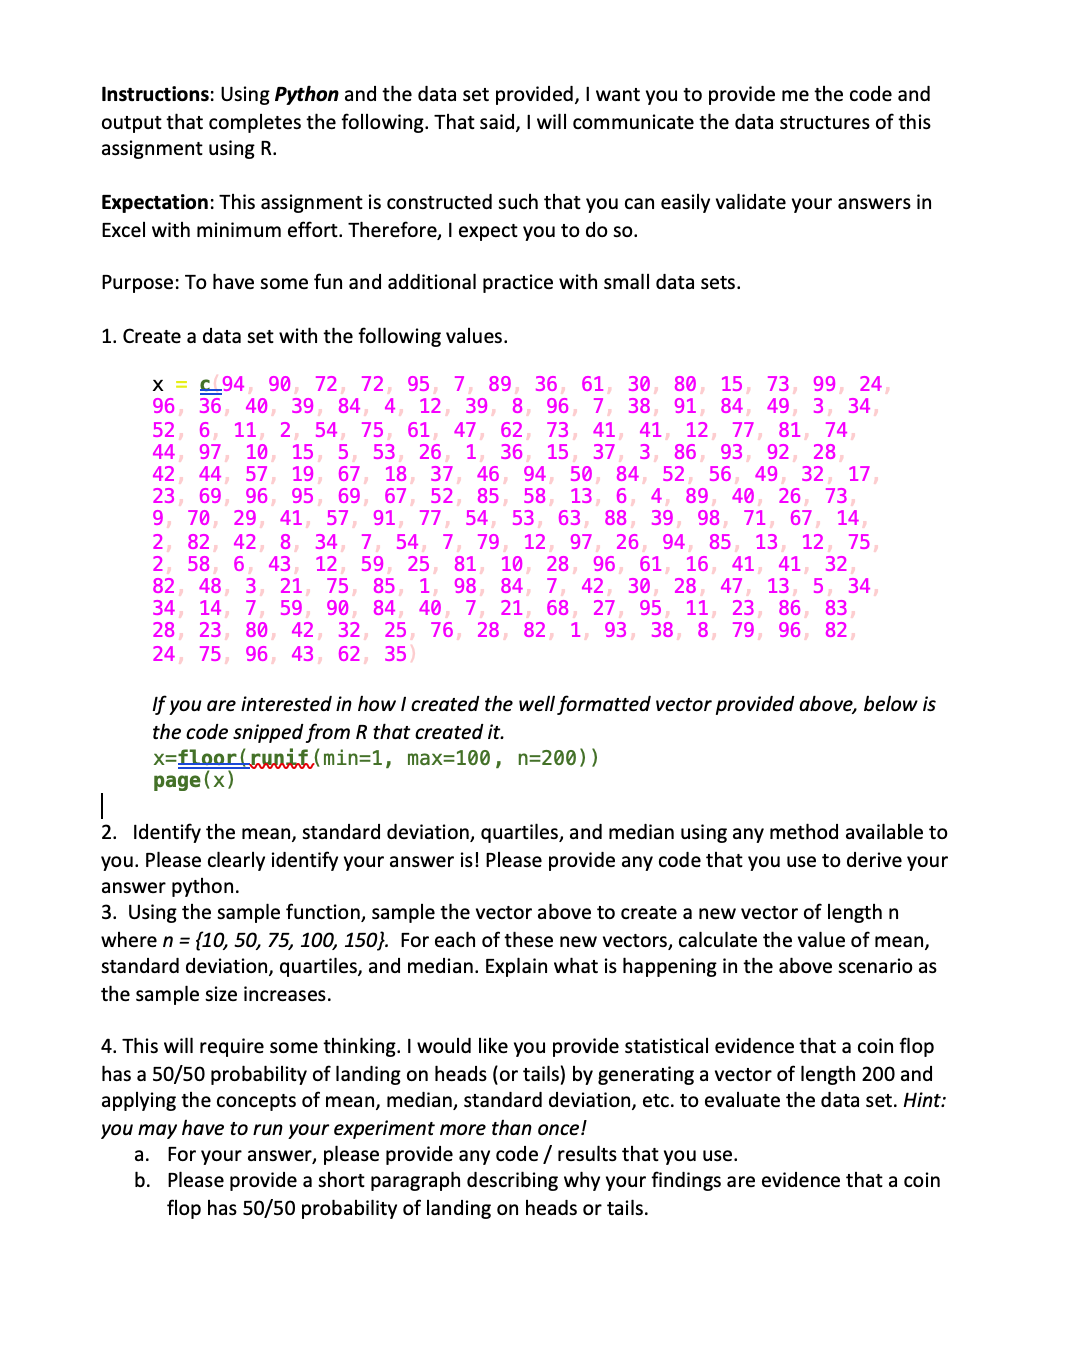
Instructions: Using Python and the data set provided, I want you to provide me the code and output that completes the following. That said, I will communicate the data structures of this assignment using R. Expectation: This assignment is constructed such that you can easily validate your answers in Excel with minimum effort. Therefore, I expect you to do so. Purpose: To have some fun and additional practice with small data sets. 1. Create a data set with the following values. x = 94, 90 72, 72, 95, 7, 89, 36, 61, 30, 80, 15, 73, 99, 24, 96, 36 40 39, 84, 4, 12, 39, 8, 96 7, 38, 91 84, 49, 3, 34, 52, 6, 11, 2 54, 75, 61, 47, 62, 73, 41 41, 12, 77, 81, 74, 44, 97 10 15 5, 53, 26, 1, 36, 15 37 3, 86 93 92, 28, 42, 44, 57 23, 69 96 9, 70, 29 2, 82 42 19, 67, 18, 37, 46, 94, 50, 84, 52, 56, 49, 32, 17, 95, 69, 67, 52, 85, 58, 13, 6 4, 89, 40, 26, 73 41, 57, 91, 77, 54, 53, 63, 88, 39, 98, 71, 67, 14, 8, 34, 7, 54, 7, 79, 12, 97 26, 94, 85, 13, 12, 75, 2 58 6, 43 12, 59, 25, 81, 10 28 96, 61, 16, 41, 41, 32 82, 48, 3, 21, 75 85, 1, 98, 84, 7, 42, 30, 28, 47, 13, 5, 34, 34, 14 7, 59, 90 84, 40, 7, 21, 68, 27, 95, 11, 23, 86, 83, 28, 23 80 42, 32, 25, 76, 28, 82, 1, 93, 38, 8, 79, 96, 82, 24, 75, 96, 43, 62, 35) If you are interested in how I created the well formatted vector provided above, below is the code snipped from R that created it. x=floor(runif(min-1, max=100, n=200)) page (x) 2. Identify the mean, standard deviation, quartiles, and median using any method available to you. Please clearly identify your answer is! Please provide any code that you use to derive your answer python. 3. Using the sample function, sample the vector above to create a new vector of length n where n = {10, 50, 75, 100, 150). For each of these new vectors, calculate the value of mean, standard deviation, quartiles, and median. Explain what is happening in the above scenario as the sample size increases. 4. This will require some thinking. I would like you provide statistical evidence that a coin flop has a 50/50 probability of landing on heads (or tails) by generating a vector of length 200 and applying the concepts of mean, median, standard deviation, etc. to evaluate the data set. Hint: you may have to run your experiment more than once! a. For your answer, please provide any code / results that you use. b. Please provide a short paragraph describing why your findings are evidence that a coin flop has 50/50 probability of landing on heads or tails.
Step by Step Solution
3.47 Rating (163 Votes )
There are 3 Steps involved in it
python import numpy as np import random Step 1 Create a data set with the given values nprandomseed4... View full answer

Get step-by-step solutions from verified subject matter experts


