

Answered step by step
Verified Expert Solution
Question
1 Approved Answer
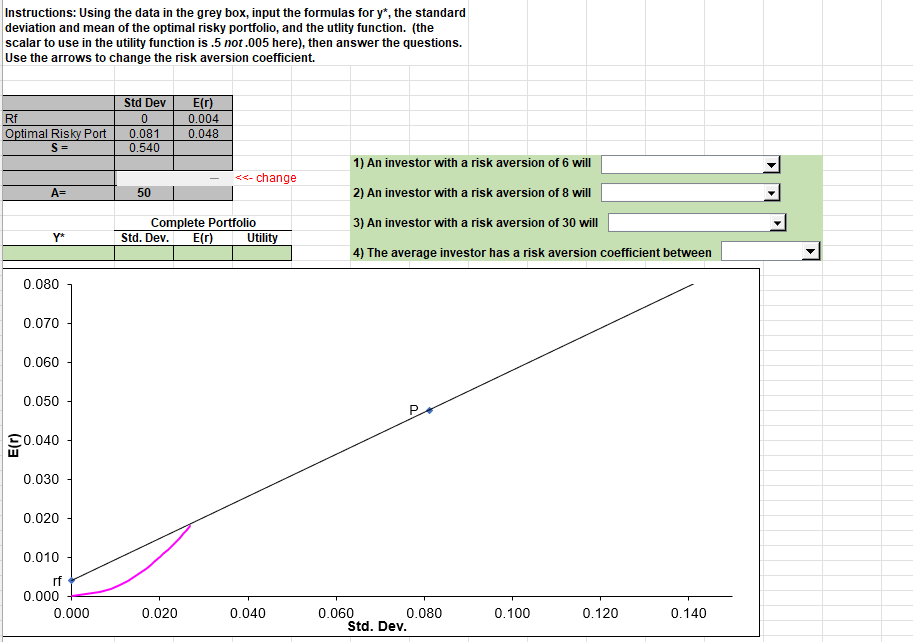
Instructions: Using the data in the grey box, input the formulas for y * * , the standard deviation and mean of the optimal risky
Instructions: Using the data in the grey box, input the formulas for the standard
deviation and mean of the optimal risky portfolio, and the utlity function. the
scalar to use in the utility function is not here then answer the questions.
Use the arrows to change the risk aversion coefficient.
Step by Step Solution
There are 3 Steps involved in it
Step: 1

Get Instant Access to Expert-Tailored Solutions
See step-by-step solutions with expert insights and AI powered tools for academic success
Step: 2

Step: 3
Ace Your Homework with AI
Get the answers you need in no time with our AI-driven, step-by-step assistance
Get Started
Cryptocurrencies And The Energy Transition Challenges And Opportunities For A More Sustainable Economy
Authors: George Elias
1st Edition
B0C1J3FC7R, 979-8389404076