Answered step by step
Verified Expert Solution
Question
1 Approved Answer
Write a program that displays the average temperature and the annual precipitation for a selected city. The user should be able to choose whether
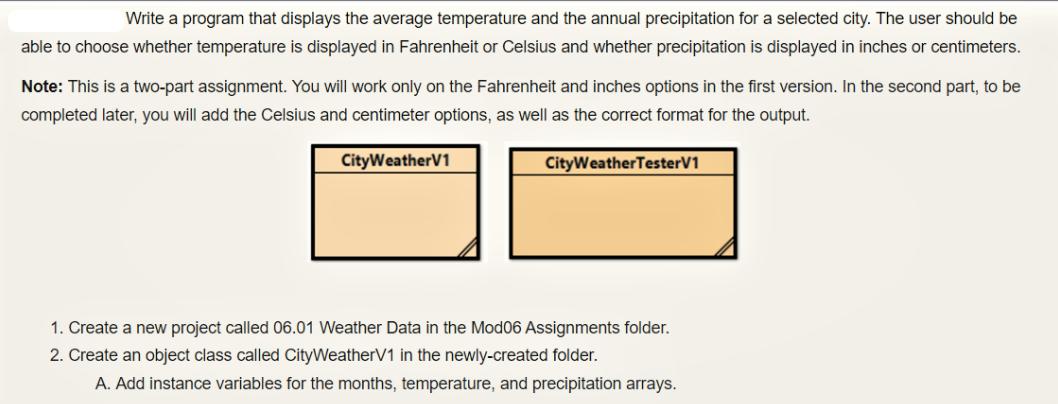
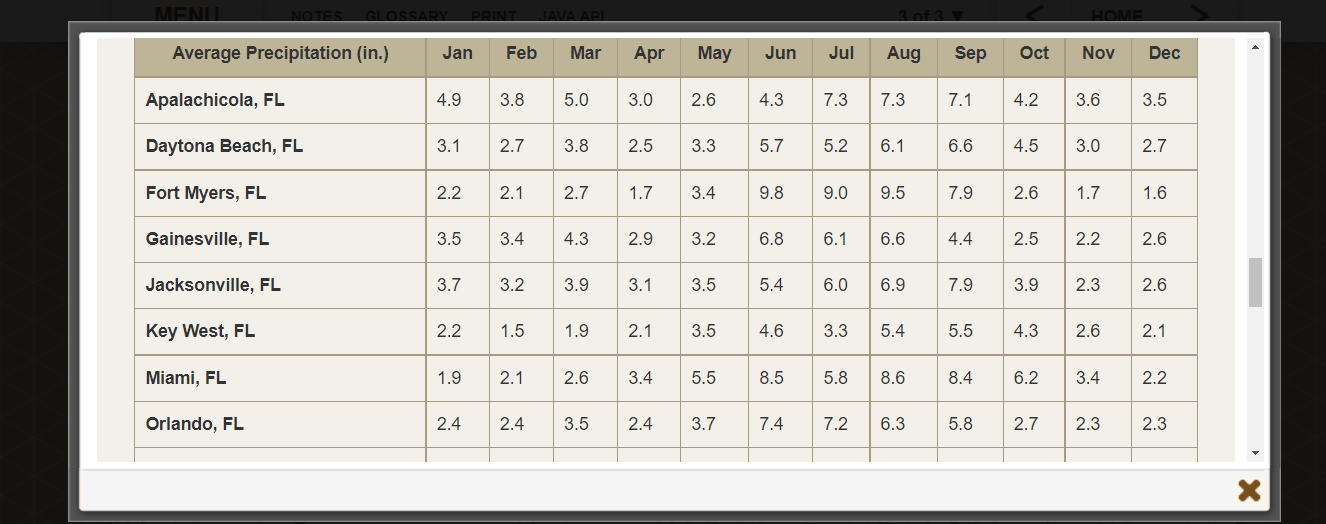
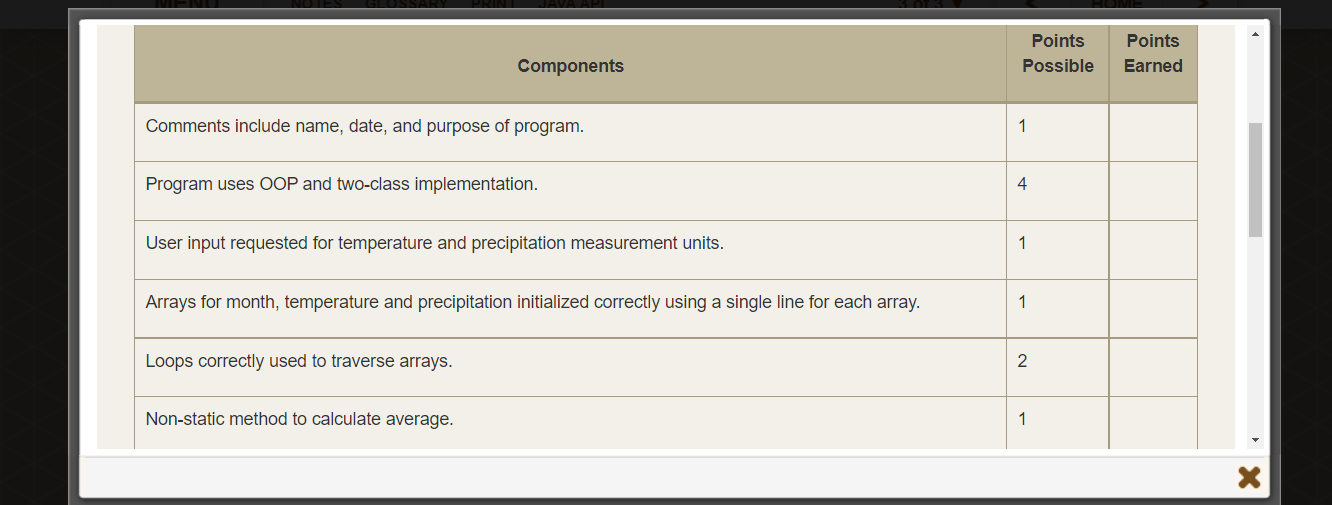
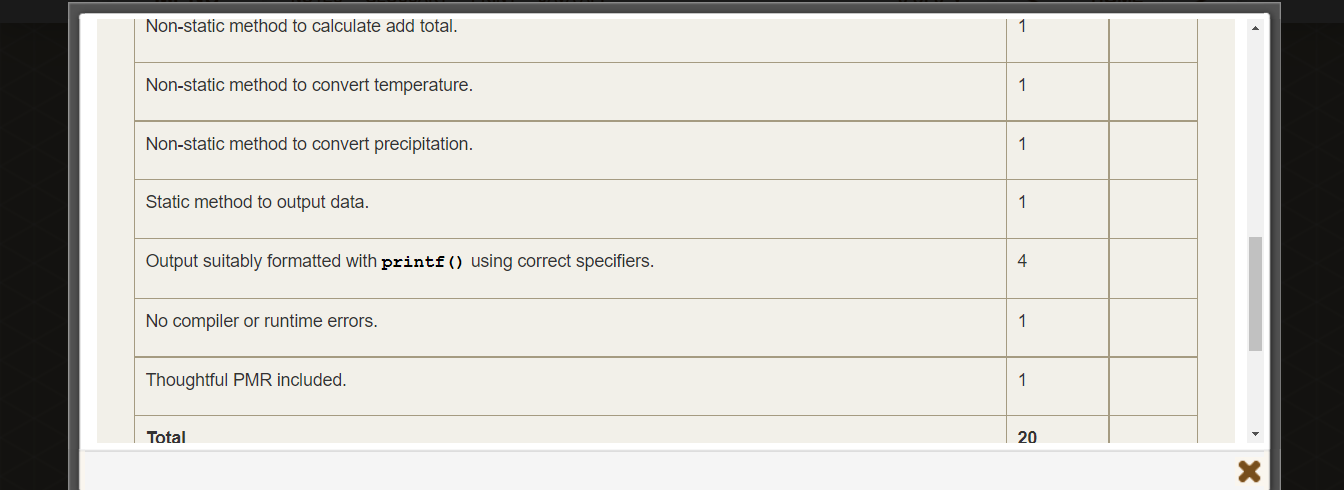
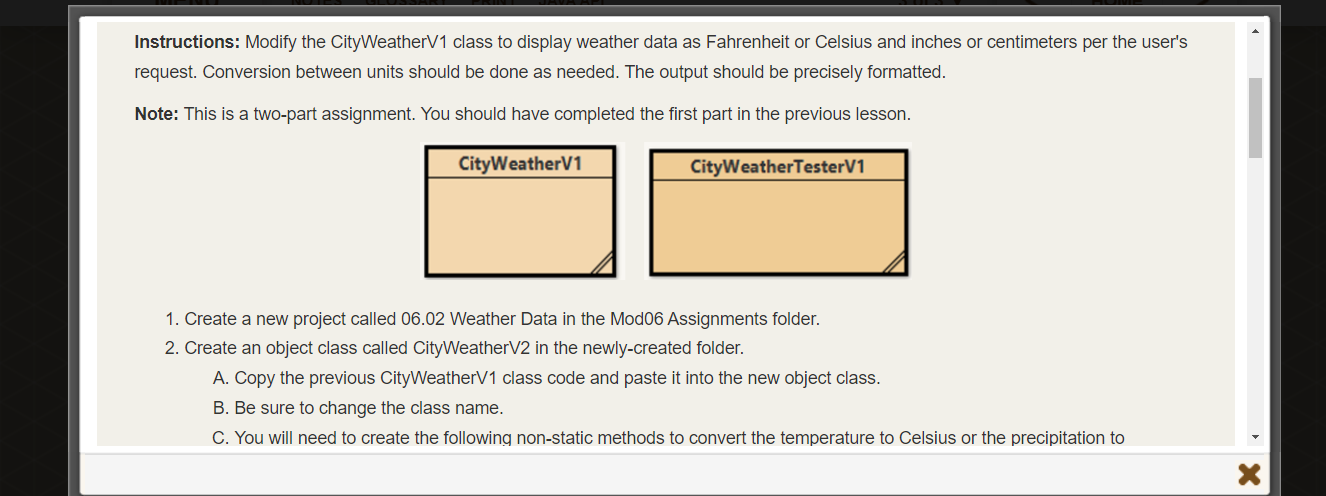
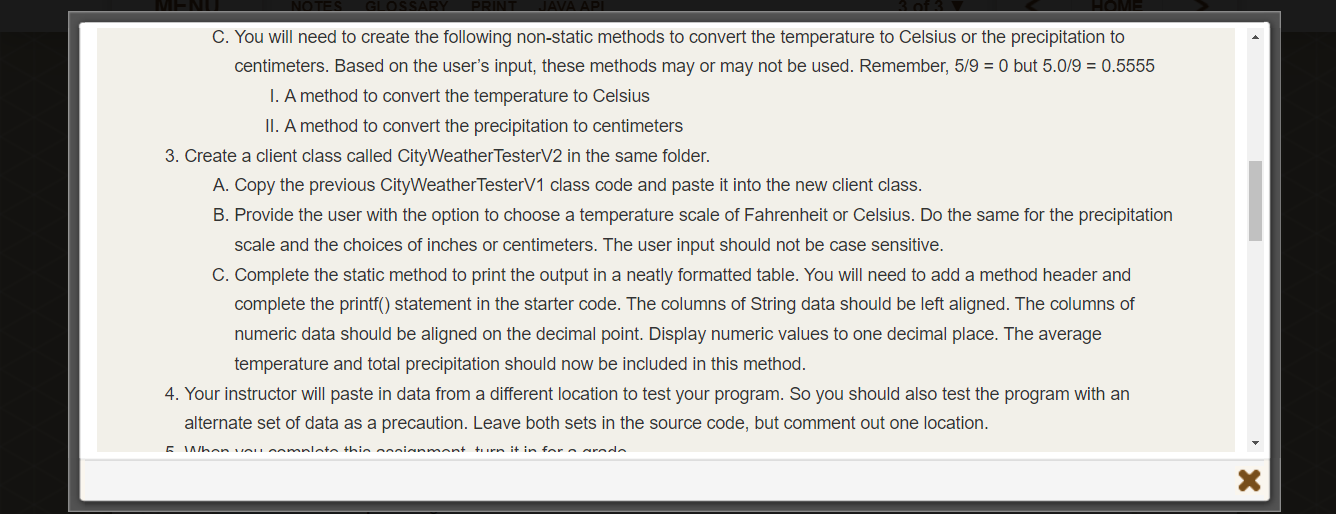
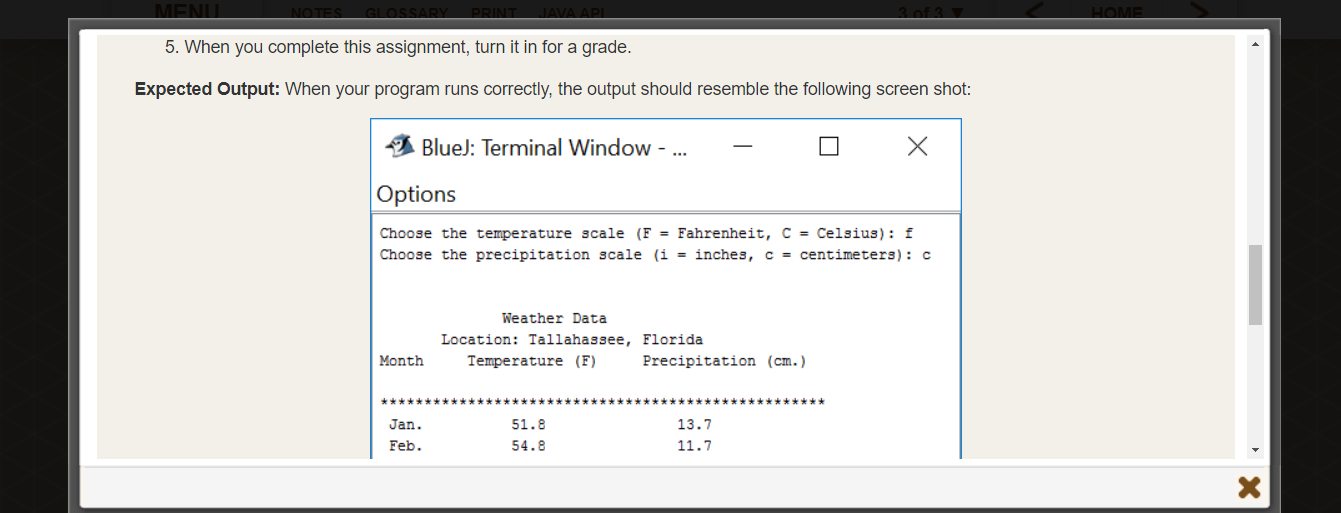
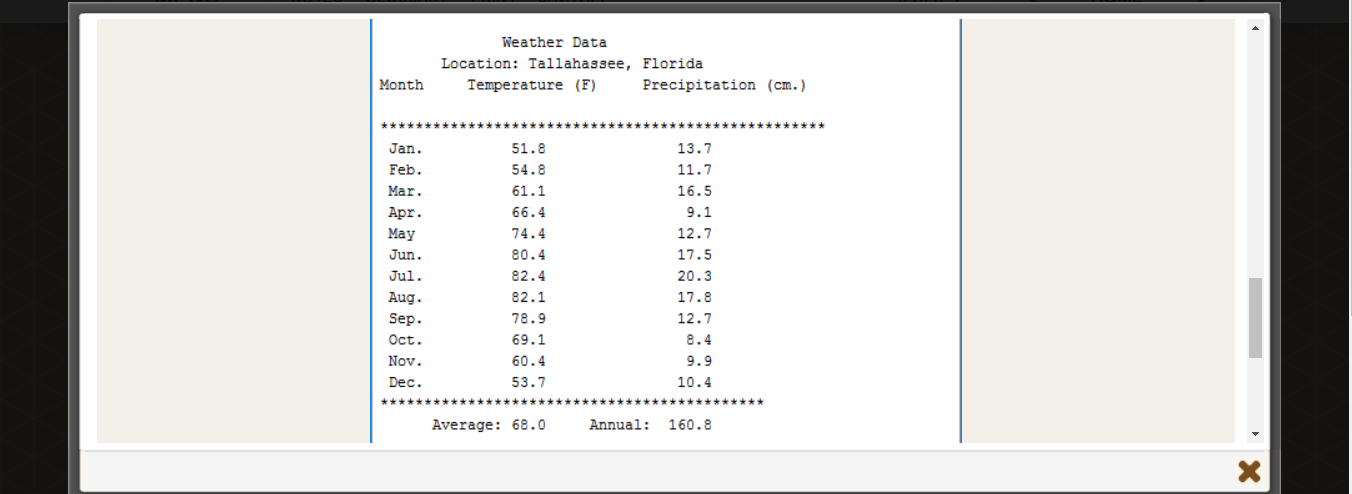
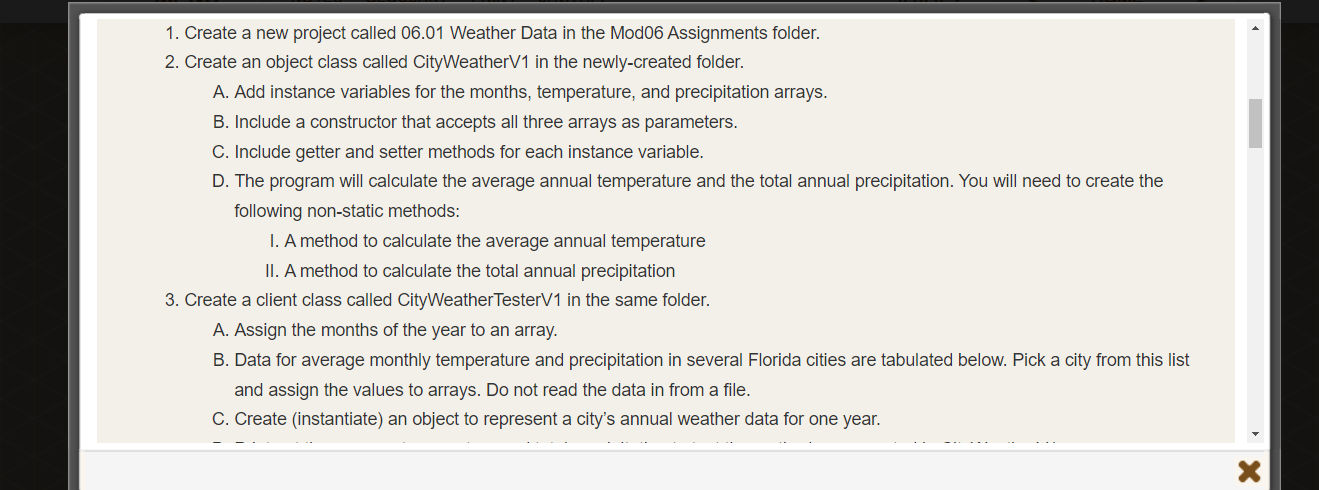
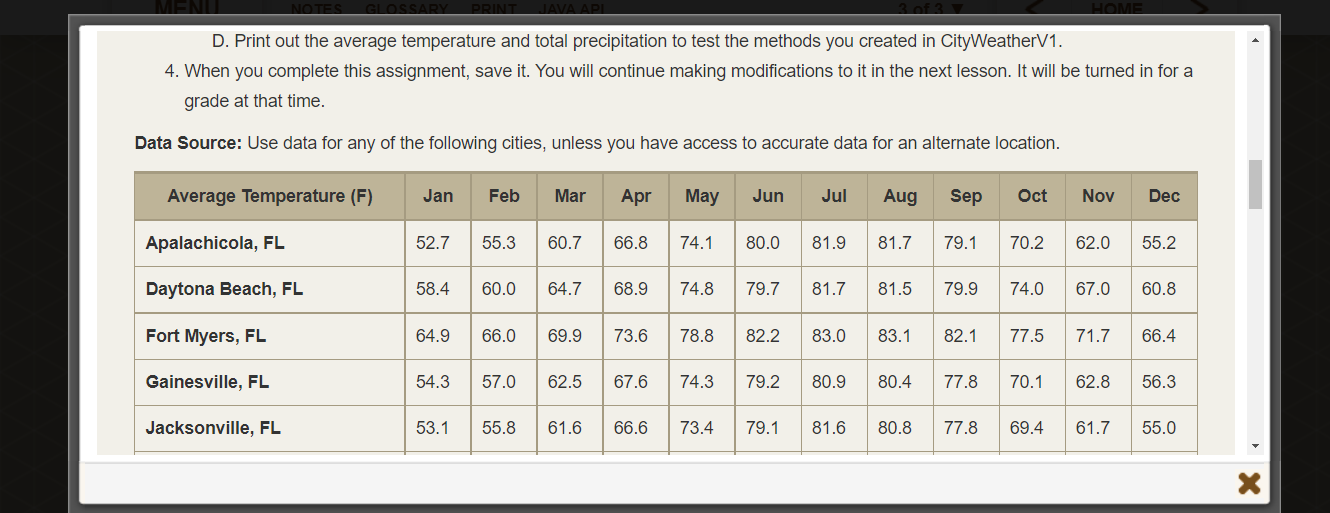
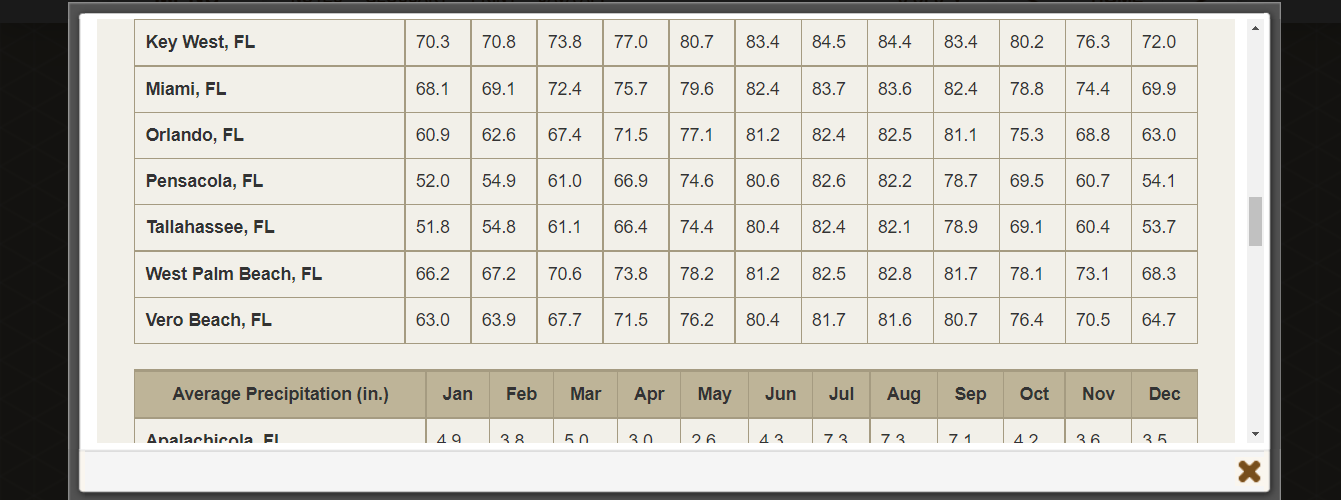
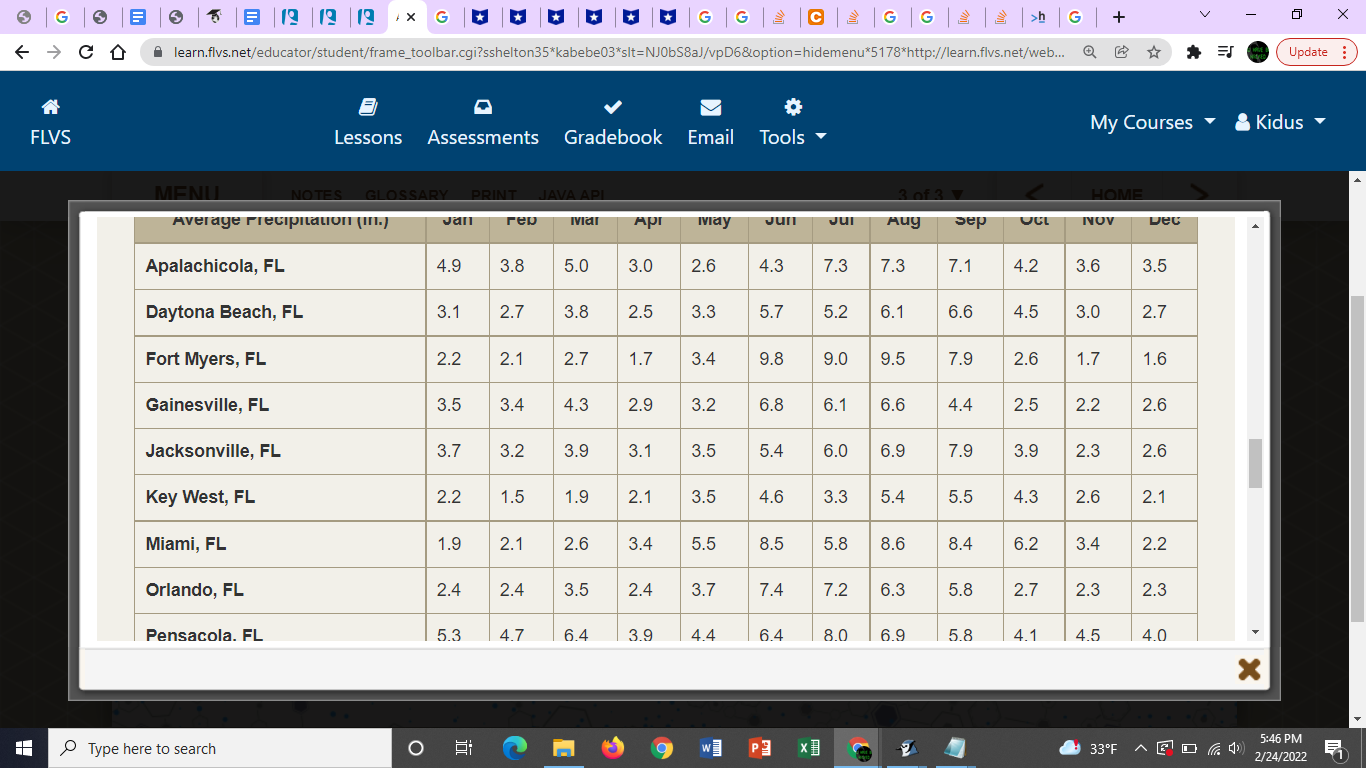
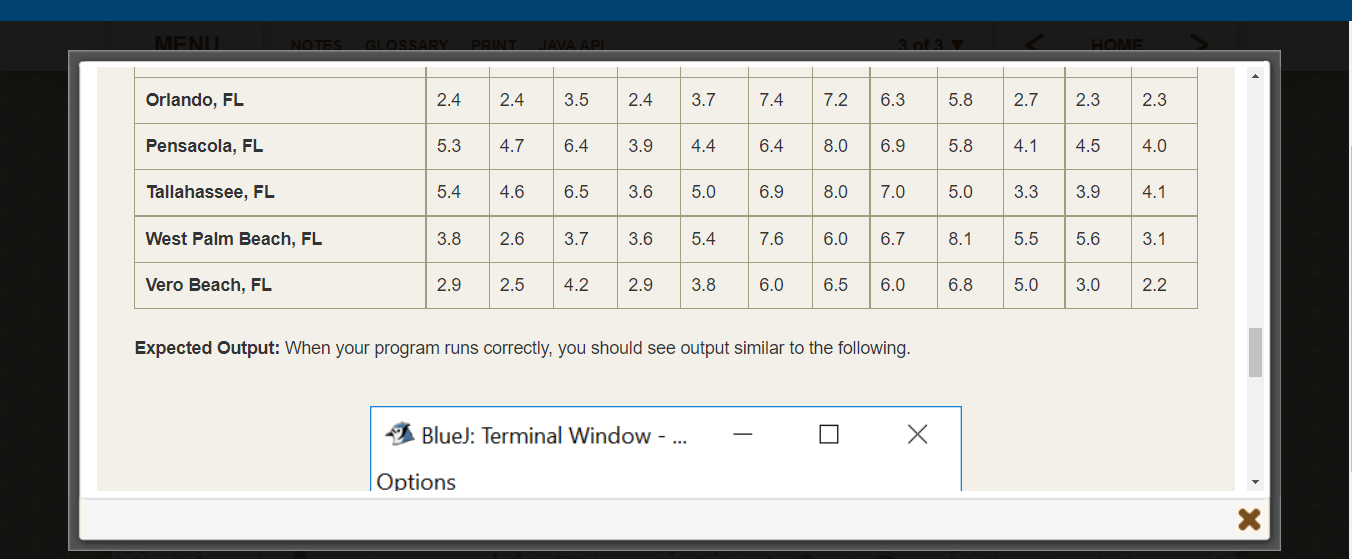
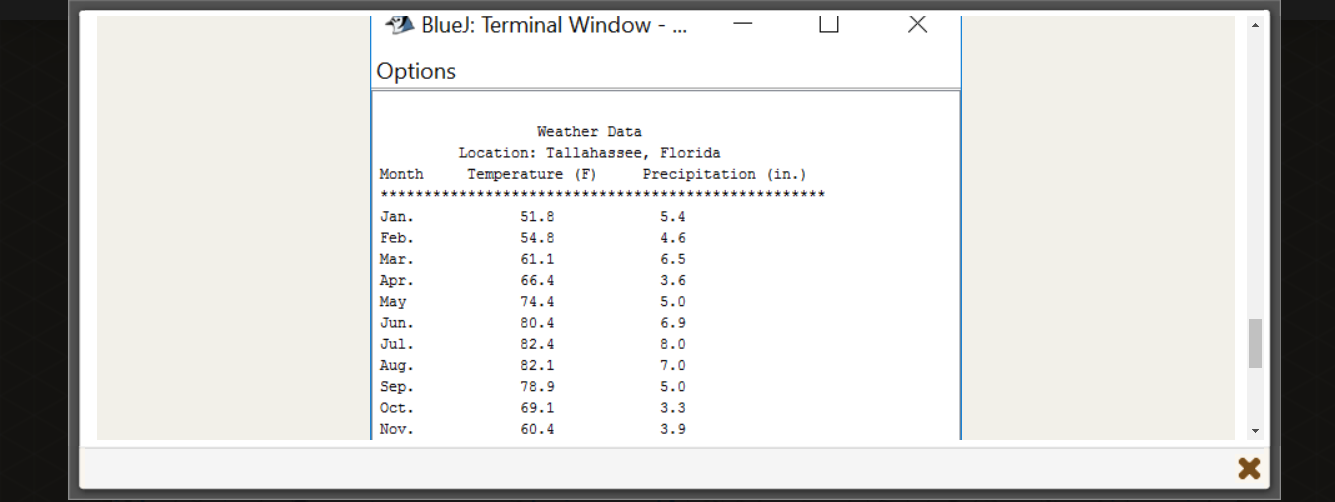
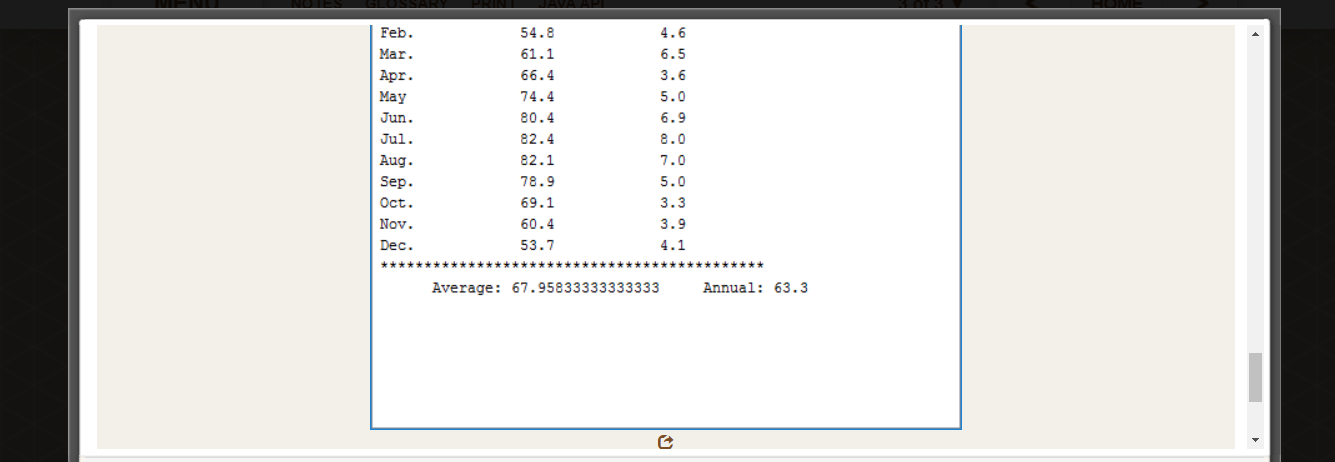
Write a program that displays the average temperature and the annual precipitation for a selected city. The user should be able to choose whether temperature is displayed in Fahrenheit or Celsius and whether precipitation is displayed in inches or centimeters. Note: This is a two-part assignment. You will work only on the Fahrenheit and inches options in the first version. In the second part, to be completed later, you will add the Celsius and centimeter options, as well as the correct format for the output. CityWeatherV1 CityWeatherTesterV1 1. Create a new project called 06.01 Weather Data in the Mod06 Assignments folder. 2. Create an object class called CityWeatherV1 in the newly-created folder. A. Add instance variables for the months, temperature, and precipitation arrays. MENIT NOTES GLOSSARY Average Precipitation (in.) Apalachicola, FL Daytona Beach, FL Fort Myers, FL Gainesville, FL Jacksonville, FL Key West, FL Miami, FL Orlando, FL Jan Feb Mar 4.9 3.1 2.2 3.7 2.2 PRINT JAVA API 1.9 2.4 3.8 5.0 2.7 3.5 3.4 4.3 2.1 3.2 1.5 3.8 2.1 2.7 3.9 1.9 2.6 2.4 3.5 Apr 3.0 2.5 1.7 2.9 2.1 3.4 May Jun Jul 2.4 2.6 3.3 3.1 3.5 3.4 3.2 3.5 5.5 3.7 4.3 7.3 5.7 9.8 6.8 5.4 4.6 8.5 7.4 9.0 3 of 3 5.2 6.1 Aug 3.3 7.3 6.1 6.6 7.2 9.5 6.0 6.9 5.4 5.8 8.6 6.3 Sep Oct 7.1 6.6 7.9 4.4 7.9 5.5 8.4 5.8 4.2 4.5 2.6 3.9 4.3 6.2 HOME 2.7 Nov Dec 2.5 2.2 3.6 3.0 1.7 2.3 2.6 3.4 2.3 3.5 2.7 1.6 2.6 2.6 2.1 2.2 2.3 X Comments include name, date, and purpose of program. Components Program uses OOP and two-class implementation. User input requested for temperature and precipitation measurement units. Arrays for month, temperature and precipitation initialized correctly using a single line for each array. Loops correctly used to traverse arrays. Non-static method to calculate average. Points Points Possible Earned 1 4 1 1 2 1 X Non-static method to calculate add total. Non-static method to convert temperature. Non-static method to convert precipitation. Static method to output data. Output suitably formatted with printf () using correct specifiers. No compiler or runtime errors. Thoughtful PMR included. Total 1 1 1 1 4 1 1 20 Instructions: Modify the CityWeatherV1 class to display weather data as Fahrenheit or Celsius and inches or centimeters per the user's request. Conversion between units should be done as needed. The output should be precisely formatted. Note: This is a two-part assignment. You should have completed the first part in the previous lesson. CityWeatherV1 CityWeatherTesterV1 1. Create a new project called 06.02 Weather Data in the Mod06 Assignments folder. 2. Create an object class called CityWeatherV2 in the newly-created folder. A. Copy the previous CityWeatherV1 class code and paste it into the new object class. B. Be sure to change the class name. C. You will need to create the following non-static methods to convert the temperature to Celsius or the precipitation to X C. You will need to create the following non-static methods to convert the temperature to Celsius or the precipitation to centimeters. Based on the user's input, these methods may or may not be used. Remember, 5/9 = 0 but 5.0/9 = 0.5555 I. A method to convert the temperature to Celsius II. A method to convert the precipitation to centimeters 3. Create a client class called CityWeatherTesterV2 in the same folder. A. Copy the previous CityWeatherTesterV1 class code and paste it into the new client class. B. Provide the user with the option to choose a temperature scale of Fahrenheit or Celsius. Do the same for the precipitation scale and the choices of inches or centimeters. The user input should not be case sensitive. C. Complete the static method to print the output in a neatly formatted table. You will need to add a method header and complete the printf() statement in the starter code. The columns of String data should be left aligned. The columns of numeric data should be aligned on the decimal point. Display numeric values to one decimal place. The average temperature and total precipitation should now be included in this method. 4. Your instructor will paste in data from a different location to test your program. So you should also test the program with an alternate set of data as a precaution. Leave both sets in the source code, but comment out one location. 5 When you complete this ansignment turn it in for a grodo X NOTES GLOSSARY PRINT JAVA API 5. When you complete this assignment, turn it in for a grade. Expected Output: When your program runs correctly, the output should resemble the following screen shot: MENIT BlueJ: Terminal Window - ... Month Jan. Feb. Options Choose the temperature scale (F= Fahrenheit, C = Celsius): f Choose the precipitation scale (i = inches, c = centimeters): c Weather Data Location: Tallahassee, Florida Temperature (F) 51.8 54.8 - Precipitation (cm.) 13.7 11.7 3 of 3 X HOME X Month **** Jan. Feb. Mar. Apr. May Jun. Jul. Aug. Sep. Oct. Nov. Dec. Weather Data Location: Tallahassee, Temperature (F) 51.8 54.8 61.1 66.4 74.4 80.4 82.4 82.1 78.9 69.1 60.4 53.7 Average: 68.0 Florida. Precipitation (cm.) 13.7 11.7 16.5 9.1 12.7 17.5 20.3 17.8 12.7 8.4 9.9 10.4 Annual: 160.8 ******** X 1. Create a new project called 06.01 Weather Data in the Mod06 Assignments folder. 2. Create an object class called CityWeatherV1 in the newly-created folder. A. Add instance variables for the months, temperature, and precipitation arrays. B. Include a constructor that accepts all three arrays as parameters. C. Include getter and setter methods for each instance variable. D. The program will calculate the average annual temperature and the total annual precipitation. You will need to create the following non-static methods: I. A method to calculate the average annual temperature II. A method to calculate the total annual precipitation 3. Create a client class called CityWeather TesterV1 in the same folder. A. Assign the months of the year to an array. B. Data for average monthly temperature and precipitation in several Florida cities are tabulated below. Pick a city from this list and assign the values to arrays. Do not read the data in from a file. C. Create (instantiate) an object to represent a city's annual weather data for one year. MENI NOTES GLOSSARY PRINT JAVA API D. Print out the average temperature and total precipitation to test the methods you created in CityWeatherV1. 4. When you complete this assignment, save it. You will continue making modifications to it in the next lesson. It will be turned in for a grade at that time. Data Source: Use data for any of the following cities, unless you have access to accurate data for an alternate location. Average Temperature (F) Apalachicola, FL Daytona Beach, FL Fort Myers, FL Gainesville, FL Jacksonville, FL Jan Feb Mar Apr 52.7 55.3 60.7 66.8 58.4 60.0 64.7 64.9 66.0 54.3 May Jun Jul 74.1 80.0 53.1 55.8 61.6 68.9 74.8 79.7 69.9 73.6 78.8 57.0 62.5 67.6 74.3 82.2 79.2 81.9 81.7 81.7 Aug 80.9 66.6 73.4 79.1 81.6 81.5 83.0 83.1 82.1 Sep Oct Nov Dec 79.1 70.2 62.0 55.2 79.9 HOME 80.8 77.8 74.0 67.0 77.5 71.7 80.4 77.8 70.1 62.8 69.4 61.7 60.8 66.4 56.3 55.0 X Key West, FL Miami, FL Orlando, FL Pensacola, FL Tallahassee, FL West Palm Beach, FL Vero Beach, FL Average Precipitation (in.) Analachicola El 70.3 68.1 60.9 52.0 70.8 73.8 77.0 80.7 83.4 84.5 84.4 83.4 80.2 76.3 69.1 51.8 54.8 49 72.4 62.6 67.4 71.5 77.1 66.2 67.2 70.6 61.1 63.0 63.9 67.7 54.9 61.0 66.9 74.6 80.6 82.6 82.2 Jan Feb Mar 38 75.7 79.6 50 66.4 74.4 73.8 78.2 Apr 82.4 83.7 83.6 30 81.2 26 71.5 76.2 80.4 81.7 80.4 82.4 82.4 82.5 81.1 May Jun 81.2 82.5 82.8 43 Jul 82.1 73 82.4 Aug 73 78.8 74.4 78.7 69.5 60.7 81.7 75.3 68.8 78.9 69.1 71 78.1 81.6 80.7 76.4 70.5 Sep Oct 60.4 42 Nov 72.0 36 69.9 63.0 73.1 68.3 54.1 53.7 64.7 Dec 35 X G CO + H FLVS MENITI = 19 19 19 X G Apalachicola, FL learn.flvs.net/educator/student/frame_toolbar.cgi?sshelton35*kabebe03*slt=NJ0bS8aJ/vpD6&option=hidemenu*5178*http://learn.flvs.net/web... Average Precipitation (III.) Daytona Beach, FL Fort Myers, FL Gainesville, FL Jacksonville, FL Key West, FL Miami, FL Orlando, FL Pensacola. FL Type here to search NOTES GLOSSARY PRINT JAVA API ivial Lessons Assessments Gradebook Email Tools Jan 4.9 3.1 2.7 2.2 3.5 3.7 2.2 1.9 2.4 5.3 3.8 5.0 10 3.2 1.5 3.8 2.1 2.7 1.7 3.4 4.3 2.9 2.4 4.7 3.9 2.1 2.6 1.9 Apr 3.5 3.0 6.4 2.5 3.1 GG 3.4 2.4 3.9 Iviay Jun 2.6 3.3 3.4 3.2 3.5 5.5 2.1 3.5 4.6 3.7 4.4 4.3 W 6.8 5.4 C 5.7 5.2 9.8 9.0 6.4 P 3 of 3 Jui Aug Sep 7.3 X 8.5 5.8 6.0 7.4 7.2 3.3 GG 6.1 6.6 8.0 7.3 6.1 9.5 6.9 5.4 8.6 6.3 6.9 2 7.1 6.6 7.9 4.4 7.9 8.4 >h 5.8 5.8 4.2 4.5 UCL NOV 5.5 4.3 2.5 3.9 6.2 G + Q 2.6 1.7 2.7 My Courses 4.1 HOME 3.6 3.0 2.2 2.3 2.6 3.4 2.3 4.5 33F Dec 3.5 2.7 1.6 2.6 2.6 2.1 2.2 2.3 4.0 ^ ES X (1) 0 X Update Kidus 5:46 PM 2/24/2022 MENIT Orlando, FL Pensacola, FL Tallahassee, FL NOTES GLOSSARY PRINT JAVA APL West Palm Beach, FL Vero Beach, FL 2.4 5.3 5.4 3.8 2.9 2.4 4.7 Options 2.6 3.5 2.5 6.4 4.6 6.5 3.6 3.7 2.4 4.2 3.9 3.6 2.9 BlueJ: Terminal Window - ... 3.7 4.4 5.0 5.4 3.8 7.4 6.4 6.9 7.6 6.0 7.2 3 of 3 6.3 8.0 6.9 8.0 7.0 6.0 6.7 Expected Output: When your program runs correctly, you should see output similar to the following. 6.5 6.0 5.8 5.8 5.0 8.1 6.8 2.7 4.1 HOME 2.3 4.5 3.3 3.9 5.5 5.6 5.0 3.0 2.3 4.0 4.1 3.1 2.2 X Options Month **** BlueJ: Terminal Window - ... Jan. Feb. Mar. Apr. May Jun. Jul. Aug. Sep. Oct. Nov. Weather Data Location: Tallahassee, Florida Temperature (F) 51.8 54.8 61.1 66.4 74.4 80.4 82.4 82.1 78.9 69.1 60.4 Precipitation (in.) 5.4 4.6 6.5 3.6 5.0 6.9 8.0 7.0 5.0 3.3 3.9 ******** X X Feb. Mar. Apr. May Jun. Jul. Aug. Sep. Oct. Nov. Dec. 54.8 61.1 66.4 74.4 80.4 82.4 82.1 78.9 69.1 60.4 53.7 4.6 6.5 3.6 5.0 6.9 8.0 7.0 5.0 3.3 3.9 4.1 Average: 67.95833333333333 ...... Annual: 63.3
Step by Step Solution
★★★★★
3.39 Rating (161 Votes )
There are 3 Steps involved in it
Step: 1
To create a Java program that displays the average temperature and annual precipitation for a select...
Get Instant Access to Expert-Tailored Solutions
See step-by-step solutions with expert insights and AI powered tools for academic success
Step: 2

Step: 3

Ace Your Homework with AI
Get the answers you need in no time with our AI-driven, step-by-step assistance
Get Started


