

Question
Instructions: You may do your analysis in Excel and turn in your worksheet(s) as backup for your written analysis. Part of the assignment includes showing
Instructions:
You may do your analysis in Excel and turn in your worksheet(s) as backup for your written analysis. Part of the assignment includes showing all your calculations. They must be clearly labeled. In addition, all required tables must still be included in the formats shown. You must include all supporting data so that your conclusions can be substantiated.
My company is: W.W. Grainger, Inc. (GWW)
- Introduction Introduce your company by explaining its products and/or services and its industry, including the mention of two or three competitors. Explain how the company produces its profits. In other words, explain how it makes money. Write this so that any reader can clearly understand how the company sells its products and/or services to generate profits. (1-2 pages)
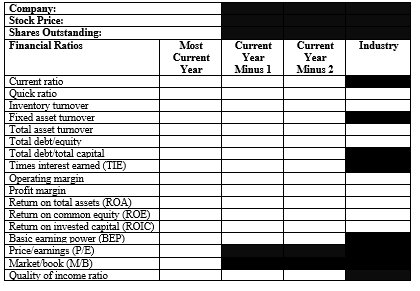
- Ratio Analysis The following tables must be included in your report in this section. Show your calculations in an attached Excel spreadsheet. This backup should include enough detail so that your calculations can be checked for accuracy. Formulas for each ratio should be based on the information found in Chapter 4 of the text. This is summarized in Table 4.2 on page 123 of the text. Two additional ratios have been added. First, calculate the total debt to equity ratio. This should be calculated with total debt equal to the sum of short/current long-term debt from the current liabilities section and the long-term debt. The total equity figure is near the bottom of the balance sheet. The second is the quality of income ratio, which shows the percentage of earnings that has been actualized into cash. It is calculated by taking the cash flow from operating activities from the statement of cash flow and dividing by the net income. A ratio of one or higher is good. In the following table, the most current year should be the year of the most current data (i.e. 2018 or 2019). If your current year is 2018, the current minus 1 should be 2017, and the current minus 2 should be 2016. Your table should include the actual years. The stock price should be the price for the stock on the day you printed your financial statements and all ratios involving a stock price should be based on that number.
In addition, show the table on the top of the next page to summarize the ROE calculations using the DuPont format. The calculated ROEs in this table should match the ROEs from the table above with some rounding. (The calculated ROE = profit margin x total asset turn x equity multiplier.)
|
| Calculated ROE | Profit Margin | Total Asset Turn | Equity Multiplier |
| Current Year |
|
|
|
|
| Current Minus 1 |
|
|
|
|
| Current Minus 2 |
|
|
|
|
Also, show this table for summarizing the calculations of the annual EVA calculation. For the cost of capital, assume 10%. Recall, that the NOPAT is equal to the EBIT (1-T). The EBIT is shown on the income statement and the tax rate can be calculated as covered in the next section.
|
| NOPAT | Total Invested Capital | Cost of Capital | EVA |
| Current Year |
|
| 10% |
|
| Current Year Minus 1 |
|
| 10% |
|
| Current Year minus 2 |
|
| 10% |
|
Note: In order to compute the companys P/E and M/B, you will need a stock price. Use the price from the date you printed the financial statements and that is at the top of the first table under the company name. For this reason, you are only being asked to provide these ratios for the current year. You will need the number of outstanding shares of common stock, which you should get from Yahoo Finance when you get the financial statements. To calculate the ROIC and the EVA, you will need the total invested capital. This should include the short/current long-term debt from the current liabilities section, the long-term debt, and the total stockholders equity. From this total subtract any short-term investments from the current asset section of the balance sheet. To calculate the NOPAT, use the earnings before interest and taxes (EBIT or Operating Income) from the income statement. You will need the tax rate. Calculate the tax rate each year by dividing the income tax expense by the income before tax found on the income statement.
In addition to calculating three years of ratios for you company, you should compare the companys ratios to industry ratios. For the industry ratios, go to csimarket.com. On the middle of the page you will see the symbol for a search. Use the green company search. Type in your company name or identifier. Once on the page for your company, select Fundamentals. Here you will be able to go to several screens and find the industry ratios to complete the table.
After the ratios and the tables for the DuPont equation and the EVA calculations, you must include a common size analysis of your companys income statement that shows all three years of the data. This will provide additional insight for evaluating your companys operating results.
Once you show all the data, then you need to evaluate the companys financial strengths and weaknesses. You can start by comparing the most recent year to the previous two years, utilizing the common size analysis as well as comparing the most recent years ratios to prior years data. You may also evaluate the companys performance compared to its industry data. Finally, you may comment on the strength or weakness of the ratio itself. For example, an ROE of 15% or more is a strong indication of the companys profitability regardless of how it compares to other data.
Your overall assessment needs to focus on financial strengths and weaknesses identified, not on one or two poor ratios. This section of the report should be approximately 2-3 pages including the tables.
- Conclusions and Summary Section Summarize all previous data with two or three paragraphs that state clearly that the company is financially strong or financially weak. Your conclusions should be supported by your analysis.
- Supporting Data Attach your Excel spreadsheet or spreadsheets. You do not need to include the financial statements from Yahoo.
Company: Stock Price: Shares Outstanding: Financial Ratios Most Current Current Industry Current Year Year Year Minus 2 Minus Current ratio Quick ratio Inventory tunover Fixed asset turnover Total asset turnover Total debt equity Total debt total capital Times interest eamed (TIE) Operating margin. Profit margin Retum on total assets (ROA) Retum on common equity (ROE) Retum on invested capital (ROIC Basic earning power (BEP) Price eamings (PE) Market book (MB) Quality of income ratio Company: Stock Price: Shares Outstanding: Financial Ratios Most Current Current Industry Current Year Year Year Minus 2 Minus Current ratio Quick ratio Inventory tunover Fixed asset turnover Total asset turnover Total debt equity Total debt total capital Times interest eamed (TIE) Operating margin. Profit margin Retum on total assets (ROA) Retum on common equity (ROE) Retum on invested capital (ROIC Basic earning power (BEP) Price eamings (PE) Market book (MB) Quality of income ratio
Step by Step Solution
There are 3 Steps involved in it
Step: 1

Get Instant Access to Expert-Tailored Solutions
See step-by-step solutions with expert insights and AI powered tools for academic success
Step: 2

Step: 3
Ace Your Homework with AI
Get the answers you need in no time with our AI-driven, step-by-step assistance
Get Started
Financial Management Of Health Care Organizations
Authors: William N. Zelman, Michael J. McCue, Noah D. Glick
3rd Edition
0470497521, 9780470497524