

Question
Instructions You will be comparing three graphs (profits, break-even, and losses) for the TWO market structures we have covered (perfect competition and monopoly). Hand-drawn graphs
Instructions
You will be comparing three graphs (profits, break-even, and losses) for the TWO market structures we have covered (perfect competition and monopoly). Hand-drawn graphs are required for this assignment. Copy/pasting graphs from the internet will not earn points.
Directions
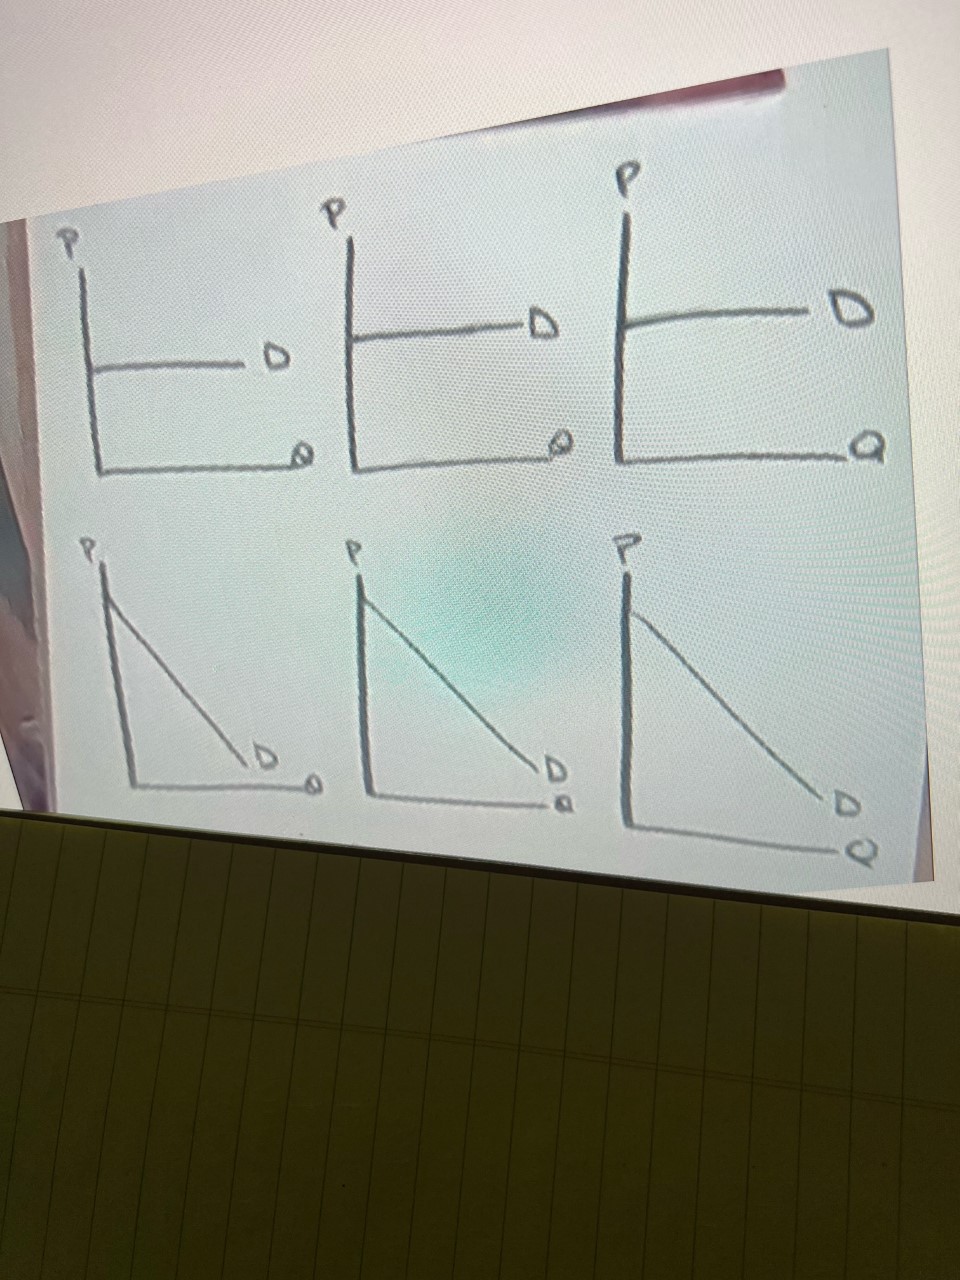
Set up your paper with TWO rows of three graphs. In total, you will have 6 graphs
You will start by drawing the demand curve for each graph (I did this in the video). You will need to add in the ATC, AVC, MR, and MC curves to each graph to show either profits, break-even, or losses. You need to follow the format on the picture I uploaded to show, please. Two rows, the first row is the 3 pictures of Perfect Competition, and the second row is the 3 pictures of Monopoly, a total of 6 pictures.
Step by Step Solution
There are 3 Steps involved in it
Step: 1

Get Instant Access to Expert-Tailored Solutions
See step-by-step solutions with expert insights and AI powered tools for academic success
Step: 2

Step: 3
Ace Your Homework with AI
Get the answers you need in no time with our AI-driven, step-by-step assistance
Get Started
The American Economy
Authors: Walter Greason, William Gorman
1st Edition
1524902675, 9781524902674