Answered step by step
Verified Expert Solution
Question
1 Approved Answer
Insurance companies and other organizations use actuarial tables to estimate the remaining lifespans of their customers. The data table below shows the estimated additional


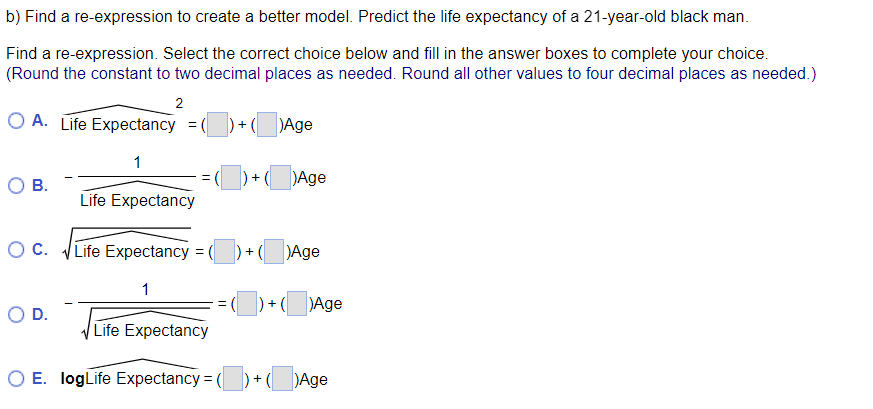
Insurance companies and other organizations use actuarial tables to estimate the remaining lifespans of their customers. The data table below shows the estimated additional years of life for black males in a certain country. Use these data to complete parts a through c below. + Age Years Left 10 62.7 20 51.4 30 40.9 40 35.3 50 26.1 a) Fit a regression model to predict Life expectancy from Age. Does it look like a good fit? Now plot the residuals. Fit the regression model. Life Expectancy=()+()Age (Round the constant to two decimal places as needed. Round all other values to four decimal places as needed.) 60 20.3 70 13.4 80 7.9 90 4.2 100 2.3 P Does this model look like a good fit? O A. Yes, the data points are close to the regression line and appear to follow a linear pattern. B. No, the data are scattered all over the plot and it does not appear that the regression model does much to explain the data. O C. Yes, while the data points are scattered all over the plot, they appear to follow a linear pattern. O D. No, while all of the data points are close to the regression line, it appears as though there is a non-linear pattern in the data. b) Find a re-expression to create a better model. Predict the life expectancy of a 21-year-old black man. Find a re-expression. Select the correct choice below and fill in the answer boxes to complete your choice. (Round the constant to two decimal places as needed. Round all other values to four decimal places as needed.) 2 O A. Life Expectancy 1 O B. = O D. Life Expectancy OC. Life Expectancy= 1 Life Expectancy O E. logLife Expectancy = ( +(Age + ( )Age + ( )Age +( )Age +( )Age Predict the life expectancy of a 21-year-old black man. Life Expectancy= (Round to two decimal places as needed.) c) Are you satisfied that your model has accounted for the relationship between Life expectancy and Age? Explain. because the residual plot a pattern and the value of R-squared is
Step by Step Solution
There are 3 Steps involved in it
Step: 1

Get Instant Access to Expert-Tailored Solutions
See step-by-step solutions with expert insights and AI powered tools for academic success
Step: 2

Step: 3

Ace Your Homework with AI
Get the answers you need in no time with our AI-driven, step-by-step assistance
Get Started


